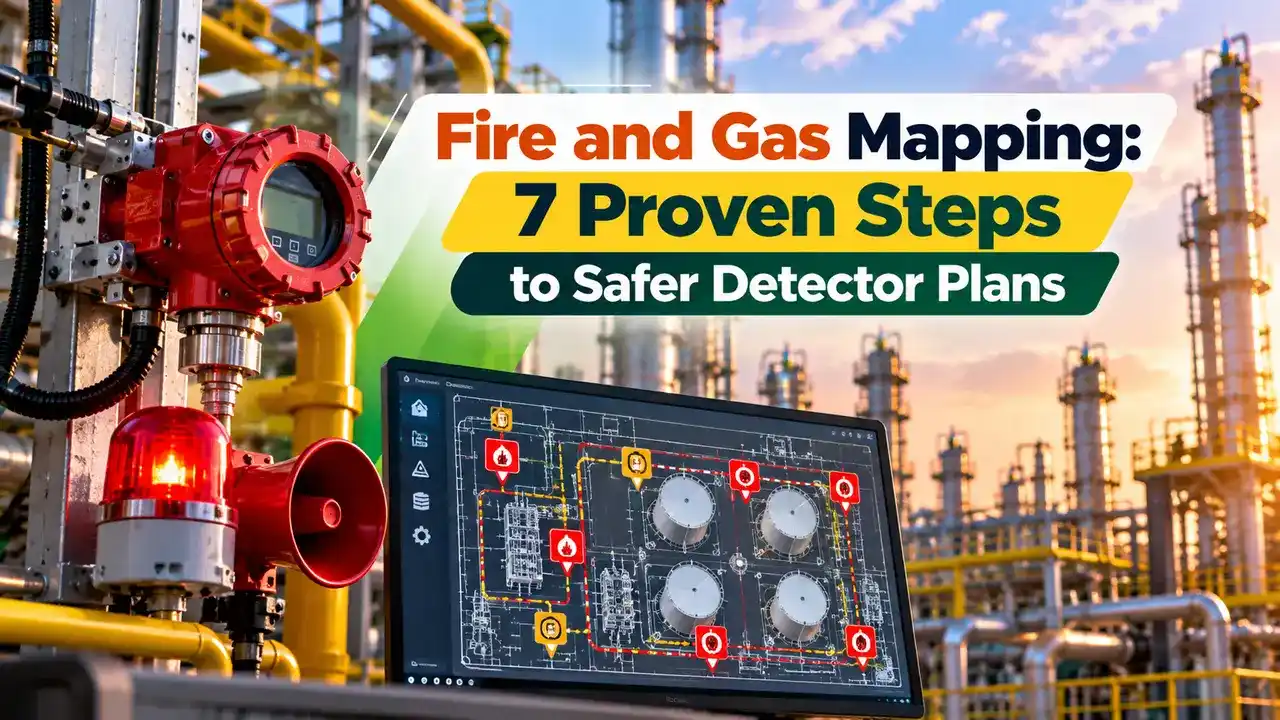
A gas detector that is placed in the wrong spot is almost as bad as having no detector at all. Coverage mapping checks, with numbers and a 3D model, whether your flame and gas detectors can really see the fires and leaks that matter.
Fire and gas mapping replaces rule of thumb detector placement with a measured coverage figure for each hazard zone. It shows gaps, overlaps and voting problems before the plant is built, when changes cost the least.
What Is Fire and Gas Mapping?
Fire and gas mapping is an engineering study that calculates how much of a process area, or how many credible fire and leak scenarios, an array of detectors can actually detect. It verifies the number, type, location, orientation and set points of the detectors used in a fire and gas system for process plants.
Kenexis, a functional safety consultancy, notes that poor detector coverage has been the biggest historical problem with these systems. A detector that cannot see a leak gives no protection, however reliable its electronics and logic solver may be.
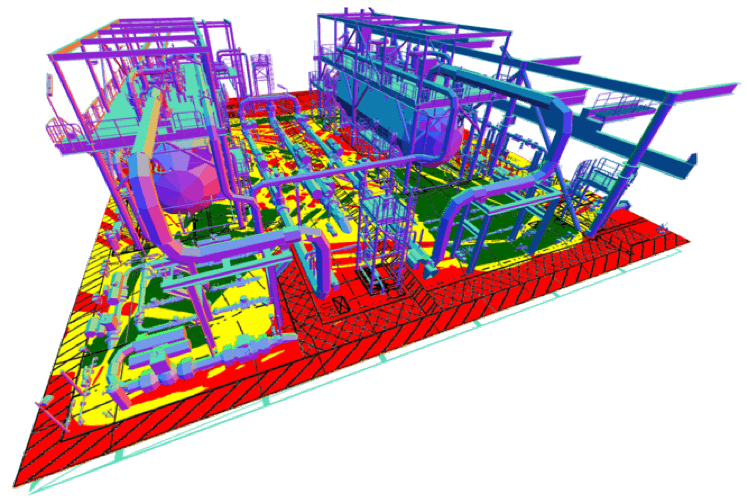
The study usually follows the hazard work done in a HAZOP study and the area classification described in hazardous area classification zones. Its output is a coloured coverage map and a list of detector changes.
Why Detector Coverage Needs Proof
Kenexis cites a UK Health and Safety Executive review of eight years of offshore data that found an effective detection rate of only about 60 percent. Its white paper also quotes an earlier HSE figure that more than 30 percent of major releases were not detected by the fixed system.
Those numbers show that sensor quality alone is not enough. Like a safety instrumented function, a fire and gas function has three parts, and detection coverage is often the weakest one.
ISA first published TR84.00.07 in January 2010 and released its second edition in 2018. Kenexis explains that it applies the risk based thinking of IEC 61511 to fire, combustible gas and toxic gas systems.
Prescriptive and Performance Based Approaches
- Simple rules such as one detector per pump or a fixed grid.
- Fast to apply and easy to audit.
- Familiar to many contractors and insurers.
- Suitable for low hazard, well understood areas.
- Targets set from hazard and risk analysis.
- Coverage measured in a 3D model.
- Finds blind spots behind vessels and pipe racks.
- Avoids both gaps and needless extra detectors.
Prescriptive design places detectors by fixed rules taken from company standards or codes. It is quick, but it gives no number that proves the layout can actually detect a leak.
The performance based method, described in ISA TR84.00.07, starts from a hazard analysis and assigns each zone a coverage target, much as LOPA and SIL assessment assigns a risk reduction target. Kenexis notes that LOPA itself has limitations for fire and gas mitigation, so a dedicated method is preferred.
Geographic Coverage Versus Scenario Coverage
Fraction of a zone area, at a chosen elevation, that the detector array can see.
Fraction of credible leak or fire scenarios detected, weighted by frequency and weather.
Each leak source gets a grade, and each grade has its own coverage target.
The Kenexis white paper defines geographic coverage as the fraction of a zone that the array can detect, which depends only on the detectors and obstructions. Scenario coverage also considers leak frequency, release size and shape and wind, so it is more complex and is kept for high risk cases.
Both measures are usually reported for single detector detection, called 1ooN, and for voted detection, called 2ooN. Voting on two detectors cuts spurious trips but needs more overlap, so 2ooN coverage is always lower than 1ooN coverage for the same layout.
Always report both 1ooN and 2ooN coverage, because a layout that looks fine for alarms may fail badly for an executive action. Check which voting your cause and effect chart actually uses.
Coverage Percentage Formula
In a geographic study, the zone is split into many small grid cells and the software tests whether each cell is seen by one, two or more detectors. Voting choices are explained further in voting architectures in safety systems.
Coverage 2ooN (%) = Cells seen by at least 2 detectors ÷ Total cells × 100
Example:
Total grid cells = 400
Cells seen by at least one detector = 340
Cells seen by at least two detectors = 250
1ooN = 340 ÷ 400 × 100 = 85.0 %
2ooN = 250 ÷ 400 × 100 = 62.5 %
Against an 80 % target, only 1ooN passes
Detector Coverage Calculator
Many published grading schemes use targets of roughly 90, 80 and 60 percent for high, medium and low hazard grades. Treat such values as examples only, because ISA TR84.00.07 expects each company to set its own targets from its risk criteria.
Sizing Point Detector Spacing for a Gas Cloud
The Kenexis white paper uses a design basis gas cloud of about 5 m, based on HSE work showing that methane clouds smaller than about 6 m are not expected to cause damaging overpressure in typical congested areas. It also describes 150 mbar of peak overpressure as the threshold for a significant explosion.
Second example:
Design cloud diameter D = 5 m
s = 5 ÷ 1.414 = 3.54 m
Area per detector = 3.54 × 3.54 = 12.5 m²
Zone of 20 m × 15 m = 300 m²
Detectors needed = 300 ÷ 12.5 = 24 point detectors
The spacing comes from the worst point in a square grid, the centre, which lies s ÷ √2 from each corner detector and must still fall within the cloud radius. Real layouts use fewer detectors near leak sources and more behind obstructions, which is exactly what a 3D model reveals for sensors such as the NDIR infrared gas detector.
The white paper notes that large open facilities such as tank farms may need to consider clouds of 10 m or more. Its minimum credible leak, a 5 mm hole such as a flange leak, sets the smallest release worth studying.
7 Proven Steps of a Fire and Gas Mapping Study
Kenexis recommends that the detection philosophy be written during planning, before detailed design. A preliminary layout is produced in FEED, and the mapping is completed when the 3D model is about 60 percent complete, then repeated whenever the design changes.
The results feed the safety requirements and the cause and effect matrix used by the emergency shutdown system. They also become part of the documentation reviewed in the safety lifecycle stages.
Detector Types and Their Coverage Shapes
| Detector | Coverage Shape in a Model | Main Use |
|---|---|---|
| Optical flame, UV, IR or triple IR | Cone of vision, for example 45 degrees each side of centre | Hydrocarbon fires in open areas |
| Point catalytic or infrared gas | Roughly a sphere around the sensor | Leaks near pumps, compressors and flanges |
| Open path infrared gas | A tube with spherical ends between transmitter and receiver | Perimeters and long pipe racks |
| Point toxic gas, such as H2S | Small sphere, placed close to sources | Toxic release warning |
| Ultrasonic gas leak | Radius based on leak noise | Pressurised gas leaks in windy areas |
Flame detector range depends on fuel, sensitivity setting and model, and Kenexis notes that the centreline range for an n heptane fire is twice that for methane. For toxic service, sensor behaviour is explained in the H2S gas detector guide, and gas group limits are covered in gas groups IIA, IIB and IIC.
Ask the vendor for the cone of vision measured to FM 3260 for your exact fuel and sensitivity setting. A catalogue maximum range for one fuel can badly overstate coverage for another.
3D Mapping Tools and How They Work
Modern tools import the plant 3D model and trace sight lines from every flame detector, so steel, vessels and walls cast real shadows on the coverage map. Gas modules either use simple cloud spheres or full dispersion results, and Kenexis states that its Effigy software models 720 wind adjusted release orientations for scenario studies.
A 2D plan view can hide blind spots under platforms and behind tanks, so 3D work is preferred for congested offshore and refinery modules. The same model helps when wearable or portable detection is added, as in the ADNOC wearable gas detector example.
Common Mistakes in Detector Placement
- Placing gas detectors without knowing the gas density and release pressure.
- Ignoring wind direction and ventilation patterns in the area.
- Mounting flame detectors where vessels or pipe racks block the view.
- Using catalogue range instead of the FM 3260 tested range.
- Reporting only 1ooN fire and gas mapping results when the logic uses 2ooN voting.
- Forgetting to repeat the study after a plant modification.
- Not linking detector actions to the cause and effect matrix.
Each detector loop must also be reliable, so proof testing and diagnostics still apply as described in proof test interval and coverage. Good coverage and good reliability together give a function that can deliver its intended risk reduction.
Where Coverage Studies Are Applied
Indian projects increasingly ask for a performance based fire and gas mapping study in their FEED scope, especially for gas processing and refinery expansions. The mapping report is often reviewed together with process safety and functional safety documents during design approval.
Kenexis White Paper on Mapping Software
Video: Flame Detector Plume Coverage Test
Fire and Gas Mapping FAQ
It is a study that calculates how much of a process area, or how many leak and fire scenarios, a detector array can detect. The result is a coverage figure and a colour map for each zone.
It replaces guesswork with measured coverage. Engineers then move, add or remove detectors until each zone meets its target.
Geographic coverage is the fraction of a zone area that detectors can see at a chosen elevation. It depends only on detector positions, settings and obstructions in the model.
Scenario coverage is the fraction of credible leak or fire events detected. It adds leak frequency, release size, direction and weather, so it needs more effort.
ISA TR84.00.07 gives guidance on evaluating the effectiveness of fire, combustible gas and toxic gas systems. Its first edition appeared in 2010 and the second edition in 2018.
It follows the risk based ideas of IEC 61511 for safety instrumented systems. Many company standards and FEED specifications in oil, gas and chemical projects refer to it directly today.
Targets come from your company risk criteria and the hazard grade of each zone. Published example schemes often use roughly 90, 80 and 60 percent for high, medium and low grades.
Always state whether a target applies to single detector or voted detection. Voted coverage is always lower than single detector coverage for the same layout of detectors in a zone.
HSE research found that methane clouds smaller than about 6 m are not expected to cause damaging overpressure in typical congestion. A 5 m design cloud therefore gives a sensible margin for detection.
With a square grid, the spacing for a 5 m cloud is about 3.5 m. Larger open sites may justify a bigger design cloud size.
A first detector layout is usually prepared during front end engineering design, using early plot plans. The detailed study is completed when the 3D model is around 60 percent complete.
It should be repeated whenever equipment, walls or pipe racks change. A plant modification without a fresh coverage study can quietly open new blind spots that nobody notices.
Yes, onshore refineries, gas terminals, tank farms and chemical units face the same fire and leak hazards. Many Indian clients now include it in their safety studies.
Open sites may use larger design clouds, while congested units need careful 3D checks. The method, the software and the reporting stay the same for both kinds of site.
Related Articles
- Fire and Gas System in Process Plants
- H2S Gas Detector Working Principle
- Voting Architectures in Safety Systems
- LOPA and SIL Assessment
- Hazardous Area Classification Zones
External References
- Understanding Fire and Gas Mapping Software, Kenexis White Paper
- Performance Based Fire and Gas System Engineering, Kenexis
- Gas Detector, Wikipedia
What We Learn Today
- Fire and gas mapping measures detector coverage in a 3D model, so engineers can prove that flame and gas detectors really see the hazards in each zone.
- Geographic coverage looks at the fraction of area seen, while scenario coverage weights credible leaks and fires by frequency, size and wind.
- A 5 m design gas cloud gives a maximum square grid spacing of about 3.5 m for point gas detectors in congested process areas.