A cold room, a vaccine fridge or a reefer truck can drift out of range at 3 in the morning when nobody is watching. A small battery powered recorder keeps a time stamped record of every reading, so you can prove the product stayed safe.
Pharma stores, food plants and vaccine cold chains all need proof that temperature stayed inside limits around the clock. A temperature data logger gives that proof with time stamped readings, as long as you choose, place and calibrate it correctly.
What Is a Temperature Data Logger?
A temperature data logger is a small, self powered instrument that measures temperature at a fixed interval and saves each reading with a date and time stamp in its own memory. Unlike a panel indicator or a temperature transmitter, it does not need a control system to record anything.
Inside are a sensor, a microcontroller, a real time clock, non volatile memory and a battery. After a trip or a study, you download the record to a PC or the cloud and print a report that shows minimum, maximum, average and every excursion.
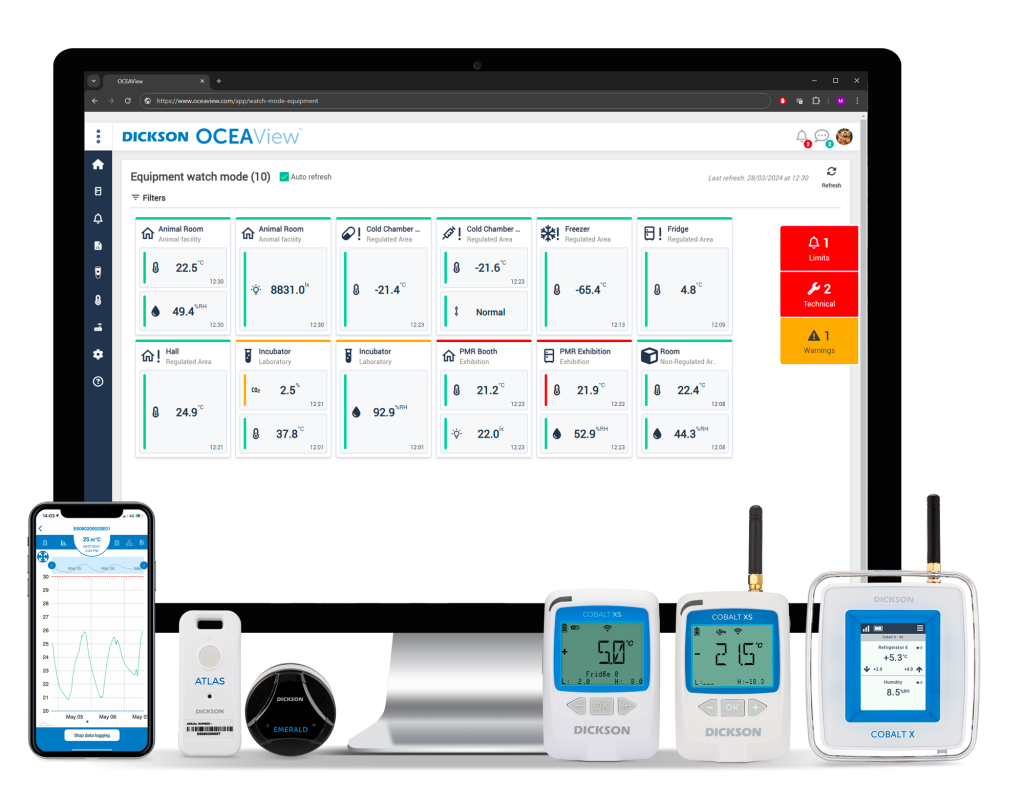
Dickson describes these digital loggers as the modern replacement for paper chart recorders. Many models also log humidity through a built in capacitive RH sensor, which is useful in warehouses and stability chambers.
Inside the Logger: Signal Path From Sensor to Report
Most of the time the electronics sleep to save the battery. At each interval the clock wakes the processor, which powers the sensor, takes a reading, compares it with alarm limits, writes it to memory and goes back to sleep.
That short wake period is why the logger reacts slowly to fast changes. The response time of the sensor and its housing often matter more than the sampling interval itself.
The CDC advises buffered probes for vaccine refrigerators, with the sensor sitting in glycol, glass beads or similar material. Dickson notes that this makes the reading follow the vaccine temperature instead of every short air swing when the door opens.
Sensor Options in a Temperature Data Logger
An NTC bead with large resistance change per degree, giving good resolution near room and fridge temperatures.
A Pt100 or Pt1000 element with stable, nearly linear output and a wide range.
Two dissimilar wires that cover very low to very high temperatures with fast response.
Combined temperature and humidity element in one housing.
Dickson lists thermistors, thermocouples and resistance thermometers as the three common sensing choices. Their trade offs in range, accuracy and drift are compared in thermistor vs thermocouple and how an RTD works.
Internal sensors keep the unit compact, but the electronics and battery then sit in the cold. For freezers below about minus 30 °C or for ovens, use an external probe so only the temperature sensor goes into the harsh zone while the body stays outside.
Types of Loggers by Data Retrieval
| Type | How Data Comes Out | Strength | Watch Out For |
|---|---|---|---|
| USB stand alone | Plug into a PC after the trip | Cheap, simple, no network | Data unseen until download |
| Single use PDF logger | Creates a PDF report when plugged in | No software needed for receivers | Cannot be reused or recalibrated |
| Bluetooth or NFC | Phone app reads it nearby | Quick checks in transit | Short range only |
| Wi Fi or Ethernet | Live upload to cloud or server | Real time alarms by SMS or email | Needs network and IT approval |
| LoRaWAN or cellular | Long range radio to a gateway | Large sites, trucks, remote stores | Gateway and data plan cost |
Dickson calls continuous cloud upload with local backup the current state of the art, because nothing is lost if the network drops. Long range options are explained in the LoRaWAN industrial IoT guide, and many cloud platforms receive data through MQTT.
Before a long trip, start the logger with a delayed start or a button press and confirm the blinking status LED. A logger that was never started is the most common reason for a blank cold chain record.
Sampling Interval and Memory Formula
Every temperature data logger has a fixed memory measured in readings, not in days. How long it lasts depends on the logging interval and on how many channels share that memory.
Memory duration in days = memory readings ÷ (channels × readings per day)
Example:
Memory = 32000 readings, interval = 5 min, channels = 1
Readings per day = 1440 ÷ 5 = 288
Duration = 32000 ÷ (1 × 288) = 111.1 days
Shorter intervals catch brief excursions such as a door left open, but they fill memory and drain the battery sooner. Pick the longest interval that still shows the events you care about.
Logger Memory Duration Calculator
Second Worked Example: A 7 Day Warehouse Study
Suppose a temperature and humidity logger stores 16000 readings in total and you plan a 1 minute interval on both channels. It fills in 16000 ÷ (2 × 1440) = 5.6 days, which is too short for a seven day warehouse study.
Switch to a 5 minute interval and the same memory lasts 16000 ÷ (2 × 288) = 27.8 days. That covers the full study with room for a delayed start, a repeat run and the time taken to collect the units.
What WHO Guidance Says About Mapping
The WHO technical supplement on temperature mapping of storage areas, published in May 2015, sets clear expectations for the loggers used in a study. Each unit should be programmable with intervals from 1 minute up to a maximum of 15 minutes.
The same document asks for a traceable 3 point calibration certificate with an error of no more than ±0.5 °C at each point, and recalibration every year. It also says memory must be enough for the full study at the chosen interval, which is exactly what the calculator above checks.
For placement, WHO suggests a horizontal grid every 5 to 10 metres, with loggers at floor level, about 1.2 m and about 3.0 m where the ceiling is 3.6 m or lower. Warehouses should be mapped for at least seven consecutive days, while freezer and cold rooms typically need 24 to 72 hours.
7 Steps to Run a Temperature Data Logger Mapping Study
Synchronising every unit to the same clock is vital, because the report compares readings taken at the same moment across the grid. A one hour clock error can make a door opening appear in the wrong place.
Tie logger positions to rack numbers and photograph each one in place. Auditors often ask exactly where the warmest logger sat, and a photo answers that in seconds.
Where Loggers Earn Their Keep
India runs one of the largest vaccine cold chains in the world, and its eVIN network uses connected temperature loggers on cold chain equipment to flag excursions. Food companies use the same records to show that a cooling step met its time and temperature limit.
Omega notes that probe loggers keep the recorder outside while the sensor sits in canning retorts or pasteurisers. For permanent process points, a DCS historian takes over the recording job.
Calibration and Accuracy Checks
A temperature data logger is only as good as its last calibration. Compare it against a reference thermometer in a stable bath or a dry block calibrator at three points that cover the range in use.
Record as found and as left values, the reference used and the measurement uncertainty of the test. Laboratories accredited to ISO 17025 issue certificates that pharma auditors accept without argument.
- Calibration certificate valid and covering the full range.
- Clock set to local time and synchronised across units.
- Interval and start mode match the protocol.
- Alarm limits entered correctly, for example plus 2 and plus 8 °C.
- Battery level checked or replaced before a long study.
- Memory set to stop when full, not to overwrite.
- Probe cable routed through door seals without crushing.
Many single use loggers have sealed batteries and cannot be recalibrated at all. WHO allows such units only within their certified life, after which they must be replaced.
Choosing the Right Logger for Your Site
Before buying a temperature data logger, start from the range and accuracy you need, then choose the sensor and data retrieval method. A deep freezer at minus 70 °C needs an external probe, while a pharmacy fridge suits a compact unit with a buffered probe and live alerts sent through alarm management rules.
Check that software keeps an audit trail, user logins and electronic signatures if the data supports GMP decisions. Dickson links this to the ALCOA principles of attributable, legible, contemporaneous, original and accurate records, and battery life planning follows the same logic as battery backup time calculation.
Troubleshooting Common Logging Problems
Flat lines or missing data on a temperature data logger usually mean the logger never started, the battery died or memory filled up early. Gaps in a cloud record often trace back to Wi Fi dead zones inside metal cold rooms, so test signal strength before installation.
Sudden spikes at the same time on many units point to a real event, such as defrost or a door left open. A spike on one unit only suggests a sensor fault, poor placement near a light or a damaged probe cable, which are typical temperature measurement errors.
- Records around the clock without an operator.
- Small, battery powered and easy to place anywhere.
- Time stamped data supports audits and claims.
- Wireless models raise alarms in real time.
- USB units show data only after download.
- Battery and memory set a hard limit on duration.
- Internal sensors cannot go into extreme temperatures.
- Needs regular calibration and clock checks.
WHO Temperature Mapping Technical Supplement
Setting Up a Logger on Video
Temperature Data Logger FAQ
It measures temperature at a fixed interval and stores each reading with a time stamp in its own memory. It works on a battery without any operator or control system.
After the trip or study, the record is downloaded and turned into a report. That report shows minimum, maximum, average values and every excursion outside the set limits.
Thermistors give good resolution around fridge and room temperatures at a low cost. RTD probes are more stable over time and suit pharma mapping studies and deep freezers.
Thermocouples cover the widest range and suit ovens, autoclaves and furnaces. Choose an external probe whenever the electronics and battery would otherwise sit in extreme cold or heat.
WHO guidance for mapping asks for loggers programmable from 1 minute up to a maximum of 15 minutes. Many teams use 5 minutes for warehouses as a practical balance.
Fridges and freezers with frequent door openings may need 1 or 2 minutes. Always check that memory and battery can cover the whole study at that interval.
Divide the memory capacity by the number of channels times the readings taken per day. Readings per day equal 1440 divided by the logging interval in minutes.
A unit holding 32000 readings at a 5 minute interval on one channel lasts about 111 days. Logging humidity on a second channel as well halves that duration on most models.
WHO asks for recalibration every year, using a traceable 3 point check across the range in use. The error at each point should be no more than ±0.5 degrees Celsius.
Single use units with sealed batteries cannot be recalibrated, so replace them at the end of their certified life. Keep the certificate with every study report.
WHO suggests a grid every 5 to 10 metres along the length and width of the store. Loggers go at several heights, such as floor level, 1.2 m and 3.0 m in lower stores.
Add extra units near doors, docks, windows and air handling outlets. The final count depends on the floor area, rack height and risk assessment.
A stand alone logger proves what happened, but a USB unit cannot warn anyone during an excursion. That gap can mean lost product before anyone looks at the data.
Wi Fi, LoRaWAN and cellular loggers send live alarms by SMS or email. For critical stores, use connected units or a continuous monitoring system with alarms and an audit trail.
Related Articles
- Types of Temperature Sensors
- Dry Block Calibrator
- Capacitive Humidity Sensor
- Temperature Sensor Response Time
- LoRaWAN Industrial IoT Guide
External References
- Temperature Mapping of Storage Areas, WHO Technical Supplement
- What Is a Temperature Data Logger, Dickson
- Data Logger, Wikipedia
What We Learn Today
- A temperature data logger samples a sensor at a fixed interval and saves each time stamped reading, so you can prove storage limits were held.
- Memory duration equals memory readings divided by channels times 1440 over the interval, so 32000 readings at 5 minutes last about 111 days.
- WHO mapping guidance asks for 1 to 15 minute intervals, ±0.5 °C calibrated loggers and at least seven days of warehouse data.