A control valve can look fine from the outside while its packing grips the stem, its spring has relaxed or its plug no longer seats properly. One slow stroke recorded by a smart positioner draws a picture that reveals these hidden faults in minutes.
A smart positioner can stroke a valve slowly and record actuator pressure against travel. That single valve signature test shows friction, spring range, seat load and response problems before they upset the process.
What Is a Valve Signature Test?
A valve signature test is an offline diagnostic in which the positioner ramps the valve slowly through its full stroke in both directions while recording actuator pressure against stem travel. The resulting plot is a fingerprint of the complete valve, actuator and positioner assembly.
Every mechanical part leaves its mark on that fingerprint, from packing friction to spring rate and plug seating. Engineers compare the plot with the factory baseline to decide whether a valve really needs to come out during a turnaround, as covered in control valve troubleshooting.
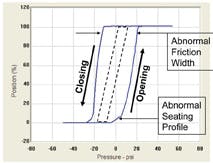
The graph above, published by Processing Magazine, compares the expected signature of a steam conditioning valve with the recorded one. The recorded friction was roughly twice the expected value and the seating profile showed a shallow angle instead of a sharp transition, which pointed to plug and seat trouble.
How Pressure Versus Travel Is Recorded
Before smart positioners, a technician had to fit a pressure transducer and a travel transducer on the valve and log both on a recorder. Today a HART or fieldbus positioner carries its own pressure sensors and travel feedback, so the test runs from a handheld or from asset software through the HART protocol.
The input is ramped slowly, typically from slightly below 0 percent to slightly above 100 percent and back again. Emerson notes that its factory signature is recorded from minus 5 to 105 percent input, so the seating and full open regions are captured too.
A slow ramp matters because the analysis assumes the actuator is almost in static balance at every point. If the ramp is too fast, dynamic pressure lag widens the loop and makes friction look larger than it really is.
Processing Magazine reported a case in which online diagnostics found that valve hysteresis had quadrupled within one month. Positioning accuracy was also poor, which pointed to actuator fatigue well before operators noticed any process upset.
6 Checks a Valve Signature Test Reveals
Half the pressure gap between the opening and closing curves, multiplied by actuator area.
Extrapolated pressures at 0 and 100 percent travel show the actual spring range.
The slope of the curve in the stroking region gives force per unit travel.
Extra pressure or spring force available once the plug touches the seat.
The shape of the curve near closed shows how cleanly the plug lands.
The measured stroke compared with rated travel and calibration end points.
Each check links to a physical part described in basic parts of a control valve. Reading all six together is what makes the valve signature test far more powerful than a simple stroke check.
Reading the Signature Plot and Friction Formula
On the plot, the opening curve sits above the closing curve because friction always opposes motion. The vertical distance between the two curves at the same travel is therefore twice the friction expressed as pressure.
Mean spring pressure = (P open plus P close) ÷ 2
Friction ratio = F ÷ (Mean pressure × A) × 100
P open and P close at the same travel, psi; A = effective area, in²
Example:
A = 69 in², P open = 10.2 psi, P close = 8.6 psi at 50 percent travel
Pressure band = 1.6 psi
F = 1.6 ÷ 2 × 69 = 55.2 lbf, about 245.5 N
Mean pressure = 9.4 psi, actuator force = 648.6 lbf
Friction ratio = 55.2 ÷ 648.6 × 100 = 8.5 percent
Very low friction with graphite packing may mean the packing is loose and leaking, while very high friction causes stick slip and loop cycling. The sizing link between force and area is explained in diaphragm actuator vs piston actuator.
Valve Friction Calculator From Signature Data
Second Worked Example: Bench Set and Seat Load
Suppose an air to open globe valve has a nameplate bench set of 6 to 30 psi and an area of 69 in². The signature shows the closing curve leaving the seat at 7.5 psi and the line through the stroking region reaching 100 percent at 31 psi.
The lower bench set has therefore risen from 6 to 7.5 psi, which raises the spring preload on the seat. Seat load from the spring is roughly 7.5 × 69 = 517.5 lbf before fluid forces, so a falling value on later tests warns of spring relaxation and possible seat leakage.
For an air to close valve the logic reverses, and seat load comes from supply pressure above the upper bench set. Required shutoff force depends on the leakage class in control valve seat leakage classes and on the fail action described in fail safe valve positions.
Always note the supply pressure on the test record. A valve signature test taken at a lower supply than the baseline will show a smaller seat load even when nothing inside the valve has changed.
Offline Versus Online Valve Diagnostics
| Feature | Offline Signature | Online Monitoring |
|---|---|---|
| Process state | Valve isolated or bypassed | Valve in normal service |
| Stroke covered | Full stroke, both directions | Only the travel the loop uses |
| Key outputs | Friction, bench set, spring rate, seat load | Friction trend, travel deviation, supply pressure, drive signal |
| Typical timing | Turnaround or shutdown | Continuous, alerts in real time |
| Main value | Detailed repair decision | Early warning between shutdowns |
Online diagnostics watch the valve during normal operation and raise alerts in the DCS through HART or fieldbus. The offline valve signature test then confirms the fault and tells the workshop exactly which part to replace.
Processing Magazine described an offline signature that helped decide whether a 20 inch steam valve truly needed removal. A failure of that valve had cost about one million dollars in lost production each day, so avoiding a needless pull was very valuable.
Step Response and Dynamic Tests
A signature shows static behaviour, but loop performance also depends on how fast and how accurately the valve answers small changes. Step tests apply small input steps such as 0.5, 1, 2 and 5 percent and record dead time, response time and overshoot.
The standard ISA 75.25.01 describes how to measure control valve response from step inputs. Poor small step response is a common cause of oscillating loops, which is why tuning studies such as DCS PID auto tune and step tests should start with a healthy valve.
Emerson lists the valve signature, dynamic error band and drive signal among the baseline tests recorded at the factory. Its performance step test also captures status at 0, 25, 50, 75 and 100 percent travel for later comparison.
Valve Signature Test Procedure in the Field
Keep the ramp rate the same as the baseline test so the curves are comparable. A matching loop check, as in instrument loop checking procedure, confirms that the DCS output and feedback still agree after the work.
- Valve bypassed or process safely shut down
- Supply pressure recorded and at nameplate value
- Positioner firmware and device description supported by the tool
- Travel calibration done before the test
- Same ramp rate and range as the baseline
- Pressure limits set below actuator rating
- Results saved with tag, date and supply pressure
- Positioner returned to in service mode
Run a fresh travel calibration before the valve signature test if the linkage was disturbed. A wrong zero or span shifts the whole plot and can be mistaken for a bench set fault.
Troubleshooting With Signature Patterns
| Pattern on the Plot | Likely Cause | Typical Action |
|---|---|---|
| Wide gap between curves | Tight or dry packing, guide galling | Adjust or replace packing, inspect guides |
| Very narrow gap with leaks | Loose packing | Retighten to correct load, check stem finish |
| Changed slope | Broken or wrong spring | Inspect and replace springs |
| Shifted lower bench set | Spring adjuster moved or relaxed | Reset bench set to nameplate |
| Rounded seating corner | Plug or seat damage, debris | Inspect trim during shutdown |
| Jerky steps in curve | Stick slip from high friction | Treat friction, then retune loop |
Seat related patterns often go with internal passing, explained in control valve passing causes. Trim condition can also be checked against the guidance in control valve trim types.
The pressure gap between the two curves equals twice the friction, not the friction itself. Many new engineers forget to divide by two and report double the true value.
- Finds hidden mechanical faults without dismantling
- Gives clear evidence for repair decisions
- Builds a history for each valve over years
- Supports planned turnaround scope
- Needs the valve isolated for full stroke
- Results depend on supply pressure and ramp rate
- Requires a smart positioner or test kit
- Does not measure fluid forces in service
Where Signature Testing Pays Off
For emergency shutdown valves, the same idea extends to the methods in partial stroke testing of ESD valves. In every case, a baseline taken when the valve is new makes every later test far easier to judge.
ValveLink Signature Series Bulletin
Valve Signature Analysis Video
Valve Signature Test FAQ
It is an offline test in which the positioner strokes the valve slowly while recording actuator pressure against travel. The resulting plot acts as a fingerprint of the valve assembly.
Engineers read friction, bench set, spring rate and seat load from that plot. Comparing it with the factory baseline shows how the valve has changed over time.
Take the opening and closing pressures at the same travel point on the valve signature test plot. Half of their difference, multiplied by the actuator effective area, gives the friction force.
For example, 10.2 and 8.6 psi on a 69 square inch actuator give about 55 pounds force. Always remember to divide the measured pressure gap by two before multiplying.
Bench set is the pressure range over which the spring alone strokes the actuator from closed to open. On the plot it appears as the pressures extrapolated to 0 and 100 percent travel.
A shift from the nameplate value shows a moved adjuster or a relaxed spring. Correct bench set protects both seat load and full stroke capability.
The valve signature test strokes the valve across its whole travel, which would disturb any running process. The loop is therefore bypassed or the unit is safely shut down first.
Online diagnostics avoid this but only see the travel used in normal operation. The full offline test is therefore usually planned during turnarounds or short planned outages.
Seat load is the force pressing the plug onto the seat once the valve is closed. It decides whether the closed valve meets its required shutoff leakage class.
For an air to open valve it comes mainly from the spring preload set by the bench set. A falling seat load over successive tests warns of spring relaxation and coming seat leakage.
Many plants record a baseline valve signature test at commissioning and repeat it at each turnaround. Valves in severe or critical service may be tested more often.
Online monitoring between turnarounds helps decide which valves need the full test. Keep the same ramp rate and supply pressure each time so that the results compare fairly.
No, a step test and a valve signature test answer different questions about the same valve. The signature shows static mechanical health such as friction, bench set and spring condition.
Step tests show dynamic behaviour such as dead time, response time and overshoot after small input changes. A complete diagnostic record uses both tests together for every critical valve.
Related Articles
- Control Valve Positioner Working
- Control Valve Troubleshooting
- Partial Stroke Testing of ESD Valves
- Control Valve Seat Leakage Classes
- Diaphragm Actuator vs Piston Actuator
External References
- ValveLink Software Signature Series Bulletin, Emerson
- Doing Diagnostics, Processing Magazine
- Control Valve, Wikipedia
What We Learn Today
- A valve signature test plots actuator pressure against travel during a slow full stroke, revealing friction, bench set, spring rate and seat load in one picture.
- Friction equals half the pressure gap between the opening and closing curves multiplied by the actuator effective area, so 1.6 psi on 69 in² gives 55.2 lbf.
- Offline signatures need the valve isolated, while online diagnostics track friction and travel deviation in service and warn early between turnarounds.