
Nuisance trips, hot transformers and failed drive cards rarely come with a clear explanation on the panel meter. A well planned power quality survey records what the supply really did, second by second, so you can fix the cause instead of guessing.
A power quality analyzer records voltage, current, harmonics, flicker, unbalance and events against recognised measurement methods. This guide explains the classes, the parameters, safe CT clamp connection and a seven step survey you can follow on any Indian plant.
What Is a Power Quality Analyzer?
A power quality analyzer is a portable or fixed instrument that samples voltage and current waveforms on single phase or 3 phase systems and logs RMS values, harmonics, flicker, unbalance, frequency and disturbance events over days or weeks. Unlike a simple kW, kVA and power factor meter, it also records what happened during the few milliseconds when equipment tripped.
Plant engineers use it to answer practical questions such as why a drive trips at night, why a capacitor bank fails early or whether the utility supply meets its declared limits. The common disturbances it captures are explained in voltage sag, swell and flicker.
Parameters a Power Quality Analyzer Records
| Parameter | What It Shows | Typical Cause |
|---|---|---|
| RMS voltage and current | Steady level and load profile | Tap setting, load growth |
| Dips, swells, interruptions | Short events with depth and duration | Faults, motor starts, switching |
| Harmonics and THD | Waveform distortion up to the 50th order | VFDs, UPS, rectifiers, LED drivers |
| Flicker Pst and Plt | Visible lamp fluctuation severity | Arc furnaces, welders, crushers |
| Unbalance | Unequal phase voltages | Single phase loads, open delta |
| Frequency | Grid or DG frequency stability | Generator governor, islanding |
| Transients | Microsecond spikes | Lightning, capacitor switching |
Harmonic data shows which orders dominate, so you can tell a 6 pulse drive signature from a single phase load signature. The theory behind these numbers is covered in power harmonics explained and in the worked examples on THD calculation in power systems.
IEC 61000 4 30 Class A vs Class S Explained
IEC 61000 4 30 does not tell you what limits apply; it tells the instrument exactly how to measure, so two meters on the same point give the same answer. The Power Quality Blog by Elspec notes that a Class A voltage magnitude must stay within 0.1 percent of the declared input voltage over 10 to 150 percent of that value.
Full method and accuracy of IEC 61000 4 30 with time synchronised aggregation.
Survey class with relaxed accuracy and simpler processing.
Older manufacturer defined methods, now treated as obsolete.
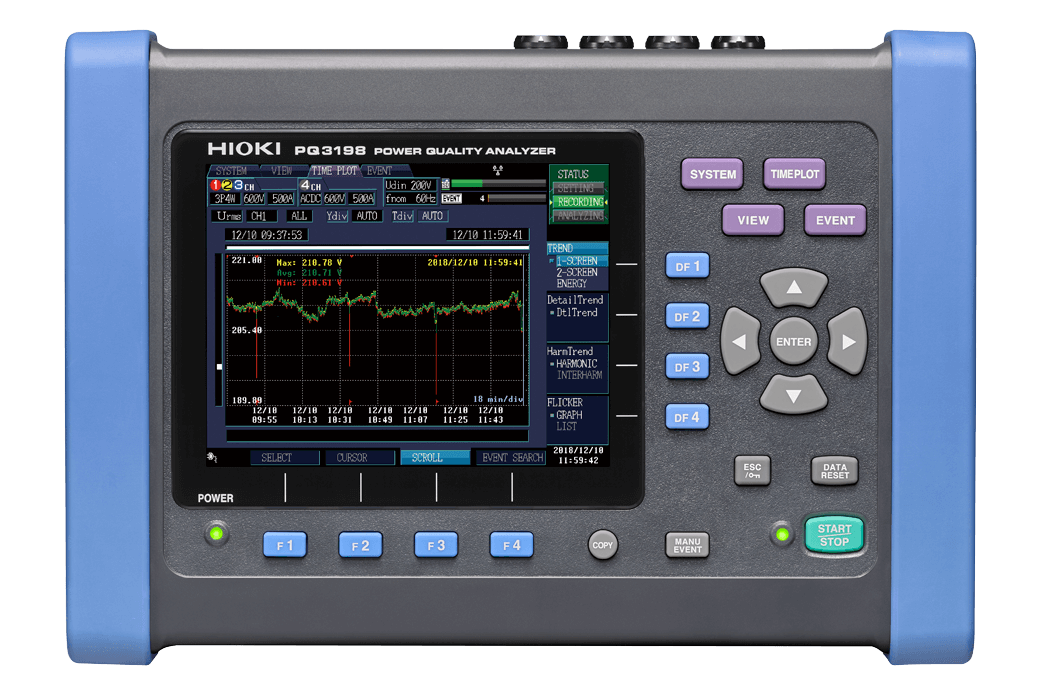
Hioki gives a clear practical comparison in its survey guide: its PQ3198 is Class A with transient capture at 2 MS/s up to 6 kV and supraharmonics from 2 kHz to 80 kHz. Its PQ3100 is Class S with 200 kS/s transient sampling up to 2.2 kV and no supraharmonic function.
Class A conformity is proven by testing to IEC 62586 2, so ask the supplier for a test certificate rather than a brochure claim. For a first plant audit a Class S power quality analyzer is often enough, but any data you may present to a utility should come from Class A.
Under IEC 61000 4 30, the 10/12 cycle window is about 200 ms at both 50 Hz and 60 Hz, because it is 10 cycles at 50 Hz and 12 cycles at 60 Hz. That is why every Class A meter worldwide shares the same basic time block.
How the Measurement Chain Works
The Elspec article explains that the 10 minute interval starts on an absolute clock boundary and the 2 hour interval on an even 2 hour boundary. Frequency is measured over 10 seconds, so a power quality analyzer needs an accurate clock, ideally from GPS or network time.
Current THD and True RMS Formula
Total harmonic distortion compares the RMS sum of all harmonic currents with the fundamental current. A power quality analyzer does this every 200 ms for each phase, but you should know how to check it by hand from a spectrum screen.
True RMS = √(I1² + I5² + I7² + I11² + I13²)
Example, 6 pulse drive feeder:
I1 = 100 A, I5 = 30 A, I7 = 12 A, I11 = 7 A, I13 = 5 A
Sum of squares = 900 + 144 + 49 + 25 = 1118
√1118 = 33.44 A
THD = 33.44 ÷ 100 × 100 = 33.44 %
True RMS = √(10000 + 1118) = 105.44 A
Harmonic Distortion Calculator
A current THD of 33 percent is normal for a drive without a reactor, yet it heats cables and transformers more than the fundamental alone suggests. Mitigation options are compared in active harmonic filter working and sizing.
Second Worked Example: Voltage Unbalance
Suppose a power quality analyzer shows line voltages of 415 V, 408 V and 400 V on a motor control centre. The average is 407.67 V and the largest deviation from it is 415 minus 407.67, which equals 7.33 V.
The simple deviation method gives 7.33 ÷ 407.67 × 100 = 1.80 percent unbalance. A Class A meter reports the more exact negative to positive sequence ratio, which will be close to this figure for small unbalance.
Connecting Voltage Leads and CT Clamps Safely
Connection errors cause more bad surveys than power quality analyzer faults. Hioki's PW3198 measurement guide advises clipping voltage leads firmly onto screw terminals or bus bars and doing zero adjustment after a 30 minute warm up.
The same guide says each clamp must surround only one conductor, with the arrow pointing toward the load. If a clamp is reversed, power for that phase reads negative and the total kW looks wrong, a problem easy to miss on a busy industrial load flow study.
Flexible Rogowski coils suit large bus bars and tight panels, while solid clamps give better accuracy at low currents. Never open the secondary of a running protection CT to fit the analyzer, for the reasons explained in CT secondary open circuit risks.
After connecting the power quality analyzer, open the wiring or vector screen before you press start. The guide notes that correct vectors should look like a fan shape, so a missing or crossed arm tells you a lead or clamp is wrong.
7 Steps for a Power Quality Survey
Hioki suggests four questions while planning: what the problem is, when it happens, where it shows up and what may be the cause. If voltage and current fall together the cause is usually upstream, while a voltage drop with a current rise points to a load inside the plant.
For large motor starts and transformer energising, set the event threshold carefully, or the memory fills with expected events. The physics of these predictable dips is covered in motor starting voltage dip and transformer inrush current.
Hioki notes that its PW3198 can store up to 1,000 events and still continues trend measurement after that limit. A poor sag threshold can use that capacity on the first day of a weeklong survey.
Reading an EN 50160 Compliance Report
EN 50160 is a European standard that describes the supply voltage characteristics a utility should deliver, and many analyzer software packages produce an automatic pass or fail report against it. It works on 10 minute values over one week, with limits such as supply voltage within plus or minus 10 percent for 95 percent of the week.
Indian utilities do not formally adopt EN 50160, yet the report is a useful yardstick for voltage level, flicker and harmonic voltage. For harmonic current at the point of common coupling, Indian practice usually follows IEEE 519, and corrective steps often begin with detuned capacitor bank sizing.
- Finds the real cause of trips and failures.
- Gives evidence for discussions with the utility.
- Measures harmonics before filters or capacitors are bought.
- Builds a baseline for energy and maintenance work.
- Class A instruments are costly to buy or hire.
- Results depend on correct connection and thresholds.
- Long surveys produce large data files to analyse.
- One location cannot show where a disturbance started.
Choosing the Right Instrument
- Confirm Class A or Class S as needed, with a test certificate.
- Check the voltage rating and CAT III or CAT IV safety category.
- Match clamp ranges to the smallest and largest feeder currents.
- Ensure harmonics to at least the 50th order and flicker per IEC 61000 4 15.
- Look for event waveform capture and adequate sampling rate.
- Verify memory size and battery backup for a one week log.
- Ask for analysis software with EN 50160 and custom reports.
- Plan annual calibration, as makers such as Dranetz recommend.
Common Survey Mistakes and Fixes
The most common mistake is a wrong CT ratio or clamp range setting, which scales every current and power reading. Check one feeder against a trusted panel ammeter or a clamp meter before you leave the site.
Photograph the panel, the connection points and the analyzer setup screen at the start. The photos save hours later when someone asks which feeder and which CT ratio were used.
Where a Power Quality Analyzer Earns Its Keep
The same data feeds energy work, since true RMS current and kW logs support energy consumption calculation and maximum demand calculation. Many plants also use the reports to justify UPS protection for critical controls.
Hioki Power Quality Measurement Guide
Power Quality Analyzer Video Demonstration
Power Quality Analyzer FAQ
It measures RMS voltage and current, frequency, harmonics, flicker, unbalance and power on every phase. It also captures short events such as dips, swells, interruptions and transients with their waveforms.
All values are logged over time, usually in 10 minute steps for trends. That record lets you match electrical disturbances with process trips and equipment failures.
Class A follows the full IEC 61000 4 30 method with tight accuracy and clock synchronised aggregation. Two Class A meters on one point should give the same result.
Class S is a survey class with relaxed accuracy and simpler processing. It suits internal audits and load studies, while Class A is preferred for contracts and disputes.
A week is the usual minimum because many problems follow shift patterns, weekends or weekly maintenance work. EN 50160 assessments are also built on one full week of 10 minute values.
For a rare fault, leave the instrument in place until the event repeats. Set sensible thresholds so the memory is not filled by normal motor starts.
Start at the main incomer or point of common coupling to see what the utility supplies. This tells you whether a disturbance comes from outside or from inside the plant.
Then move to the affected feeder or machine panel. Using two instruments at the same time is the fastest way to locate the true source.
The most likely cause is a current clamp fitted the wrong way round. The arrow on the clamp must point toward the load for every phase.
A swapped voltage lead on that phase can give exactly the same symptom. Check the vector screen, correct the connection and restart the recording before you leave the site.
Yes, and drive feeders are among the most common reasons for a survey. The instrument shows each harmonic order, so the 5th and 7th signature of a 6 pulse drive is easy to recognise.
It also gives current THD and true RMS values. These numbers help you size reactors, passive filters or active harmonic filters correctly.
EN 50160 is a European standard, so Indian utilities do not formally use it for supply contracts. Many engineers still use the automatic report as a practical benchmark for voltage quality.
For harmonic current limits at the point of common coupling, Indian practice usually refers to IEEE 519. Always confirm the exact requirement with your distribution utility first.
Related Articles
- Voltage Sag, Swell and Flicker Explained
- Harmonic Distortion THD Calculation in Power Systems
- Power Quality Issues in VFD and PLC Systems
- Active Harmonic Filter Working and Sizing
- Current Transformer Working Principle
External References
- PW3198 Power Quality Analyzer Measurement Guide, Hioki
- Power Quality Analysis Procedure: 4 Must Know Tips, Hioki
- Electric Power Quality, Wikipedia
What We Learn Today
- A power quality analyzer logs voltage, current, harmonics, flicker, unbalance and events, so you can link disturbances with trips and failures in the plant.
- IEC 61000 4 30 Class A gives repeatable, clock aligned results for contracts, while Class S suits internal surveys, energy audits and routine load studies.
- A good survey needs correct clamp direction, verified vectors, sensible thresholds and at least one week of data compared with standards such as EN 50160.