
Lights that dim for a second, a drive that trips without warning, or a bulb that visibly flickers all trace back to the same family of short duration power quality disturbances.
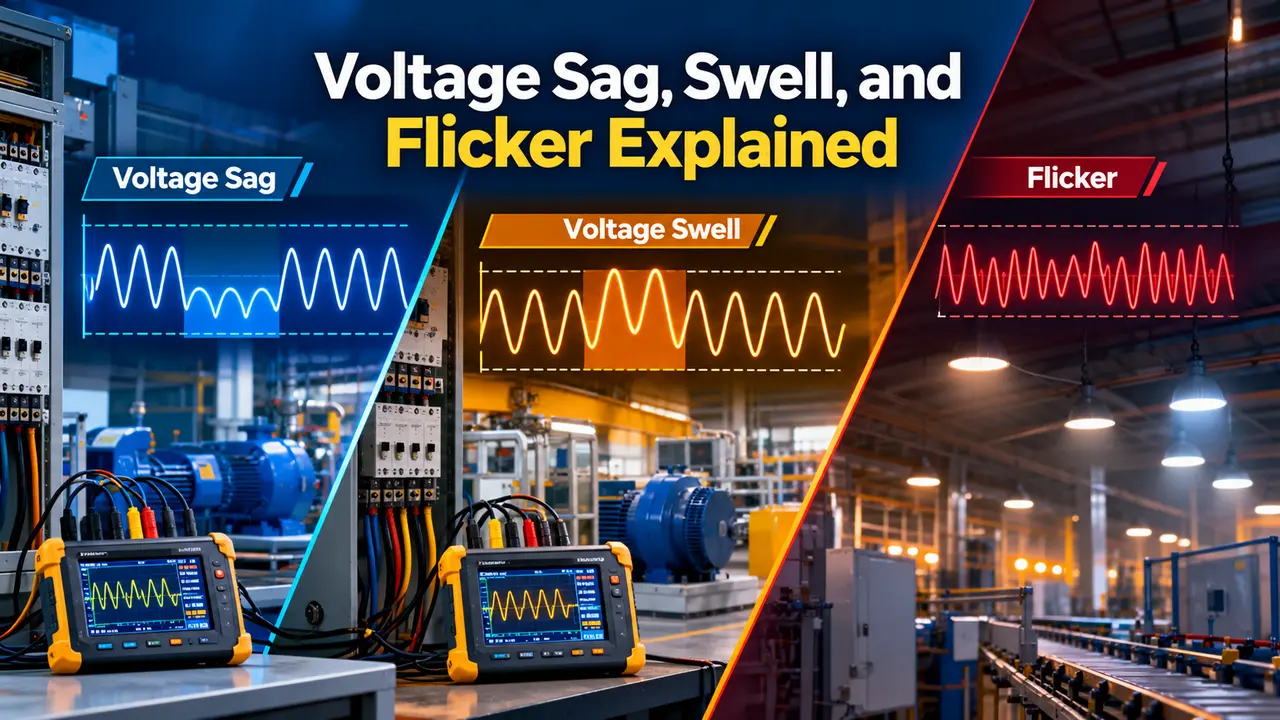
Voltage sag, swell, and flicker are three distinct short duration power quality events, a sag is a brief drop in voltage, a swell is a brief rise, and flicker is a rapid, repeated fluctuation that shows up as visible light flicker.
This complements our existing look at power harmonics and power quality issues with VFDs and PLCs.
Defining the Three Events
A voltage sag, sometimes called a dip, is a decrease to between 10 and 90 percent of nominal voltage lasting from half a cycle up to one minute, most often caused by a fault or a large motor starting nearby.
A voltage swell is the opposite, a temporary rise above 110 percent of nominal voltage for the same duration range, often caused by a sudden large load switching off or a single line fault on a nearby feeder.
Flicker is different from both, a rapid, repeated variation in voltage magnitude, usually caused by loads like arc furnaces or large motors that draw fluctuating current, perceived by the human eye as visible light flicker rather than a single dip or rise.
Reading a Recorded Waveform
A power quality recorder captures the RMS voltage on a per cycle basis, plotting it as a trend line that dips or spikes clearly whenever one of these events occurs, making them easy to spot after the fact.
Reviewing the raw waveform alongside the RMS trend often reveals the underlying cause, a fault shows a sharp asymmetric dip, while a load switching event tends to produce a cleaner step change.
Why These Are Grouped Together
All three fall under the IEEE 1159 standard's classification of short duration RMS variations, distinguishing them from the longer term harmonic distortion problems that persist continuously rather than appearing briefly.
Grouping them together makes sense operationally too, since the same power quality monitoring equipment typically captures and reports all three event types from the same recorded waveform data.
Common Causes of Each Event
| Event | Magnitude | Typical Duration |
|---|---|---|
| Sag | 10 to 90 percent of nominal voltage | Half a cycle to 1 minute |
| Swell | 110 to 180 percent of nominal voltage | Half a cycle to 1 minute |
| Flicker | Small repeated fluctuations, often under 5 percent | Continuous while the source load runs |
Impact on Plant Equipment
How Sensitive Equipment Actually Responds
A typical switch mode power supply can ride through a dip to about 70 percent of nominal voltage for several cycles before its internal capacitors discharge enough to cause a shutdown or reset.
A contactor coil, by contrast, may drop out at a much shallower dip since it depends on continuous magnetic holding force rather than stored energy, making it one of the more sensitive components in a typical control panel.
Measuring Flicker Severity
Flicker severity is quantified using short term and long term indices, commonly written as Pst and Plt, derived from statistical analysis of the voltage fluctuation over a measurement window.
A Pst value above 1.0 generally indicates flicker severe enough to be noticeable and potentially irritating to people under typical indoor lighting conditions.
Mitigation Approaches
A dynamic voltage restorer or an uninterruptible power supply, described in our UPS working principle article, can ride through a dip long enough to keep critical loads running.
A properly sized surge protector addresses transient spikes but does little for a sustained rise, which instead needs a voltage regulating transformer or an active conditioner.
Flicker from a fluctuating industrial load is often reduced with a static var compensator or careful sizing of a capacitor bank dedicated to stabilizing that specific load.
Setting Up Effective Monitoring
A dedicated power quality analyzer installed at the main incoming feed captures every event above a configurable threshold, timestamping each one so it can later be correlated with a specific process upset or equipment trip.
Placing a second analyzer closer to a suspect load, such as a large VFD or an arc welding station, helps confirm whether that specific equipment is the source of recurring disturbances rather than the incoming utility supply.
Reviewing the collected data monthly, rather than only after a complaint, often reveals a slow trend, such as gradually worsening flicker, well before it becomes severe enough to cause a visible problem.
Sag and Swell vs Long Duration Outage
Short Duration Event
Lasts under a minute, usually recoverable automatically, but can still trip sensitive equipment.
Long Duration Outage
Lasts minutes or longer, typically requires manual restoration or backup power to ride through.
Distinguishing these matters for equipment specification, ride through capability that handles a brief dip is very different from the backup runtime needed for an extended outage.
Standards and Contractual Limits
Beyond IEEE 1159's classification, many utilities publish specific limits on how often a customer connection may experience voltage sag, swell, and flicker events before corrective action is required on either side of the meter.
Large industrial customers with sensitive processes sometimes negotiate a power quality clause into their supply contract, specifying compensation or required mitigation if event frequency exceeds an agreed threshold.
Understanding these contractual limits helps a plant decide whether a recurring problem is worth escalating to the utility or is better solved with onsite mitigation equipment instead.
Common Mistakes to Avoid
Where This Shows Up on a Plant Floor
A rolling mill or crusher motor starting across the yard can produce a visible dip on lighting circuits in a nearby control room, even though the two loads share no direct electrical connection beyond the common feeder.
An arc welding bay running multiple stations at once is a classic source of visible flicker, since each welder draws a rapidly varying current as the arc strikes and extinguishes throughout the process.
Documenting which loads correlate with reported disturbances, using timestamped monitoring data rather than operator memory, is usually the fastest path to identifying and addressing the actual root cause.
Watch: Voltage Sag and Swell Simulated Results
Voltage Sag, Swell, and Flicker FAQs
Related Articles on This Site
- Power Harmonics Explained
- Power Quality Issues With VFDs and PLCs
- Surge Protector Types and Working
- UPS Working Principle
- Capacitor Bank Sizing for Power Factor Correction
External References
What We Learn Today
- A sag is a brief drop, a swell is a brief rise, and flicker is a rapid repeated fluctuation.
- All three are classified as short duration events under IEEE 1159, distinct from continuous harmonics.
- Mitigation ranges from UPS and voltage regulators to static var compensators, matched to the specific event.