Plant data is only useful if it can be found again quickly, months after it was recorded. Writing tag values into a relational database gives you reports, audits and analytics, provided the tables, indexes and retention are planned well.
Many plants send SCADA values to SQL Server or MySQL for reports and traceability. SCADA SQL logging works well when tables are designed for the data, indexes match the queries and old rows are removed on a schedule.
What Is SCADA SQL Logging?
SCADA SQL logging is the practice of writing tag values, events and batch records from a SCADA server into a relational database such as Microsoft SQL Server, MySQL or PostgreSQL, so they can be queried with standard SQL for reports and analysis. It sits between the live SCADA tag database and the reporting tools used by production and quality teams.
Unlike a closed historian file, an SQL table can be read by Excel, Power BI, MES software and custom web pages. That openness is the main reason Indian plants choose it, alongside the free editions of the database engines, as explained in how SCADA systems work.
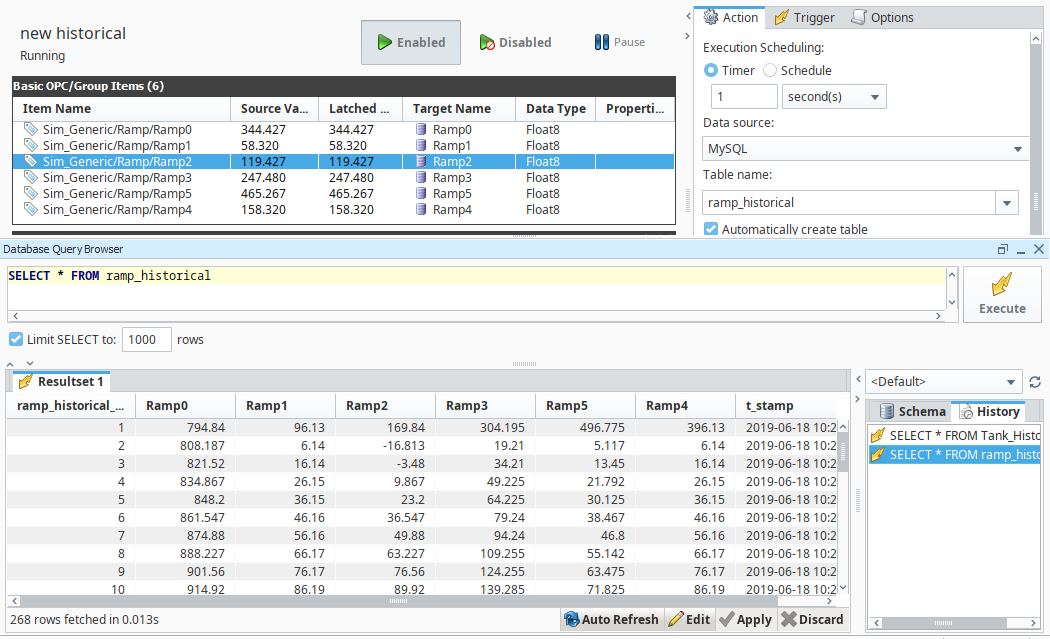
The image shows the most common pattern, where values from controllers are written row by row into a table at a fixed rate or on a trigger. The SCADA server acts as the bridge, so the PLC never talks to the database directly.
Two Ways to Write Tag Data
Each tag is stored with its own timestamp, quality and rate, in tables the software creates.
Many items share one timestamp and land as columns in a table you define.
Code inserts rows on events using SQL statements or procedures.
Inductive Automation recommends tag history for continuous processes and transaction groups for discrete ones. Its documentation explains that tag history stores values asynchronously per tag, so Tag A might be stored every 10 seconds and Tag B only twice a day.
Transaction groups store many items under one shared timestamp as a single synchronous transaction, in one wide table where each item becomes a column. They are driven by a trigger item, with optional handshake bits that tell the PLC whether the write succeeded.
Ignition tag history stores data in monthly partition tables by default, according to Inductive Automation. Each new month therefore starts a new table, which keeps any single table from growing forever.
Tall vs Wide Table Design
| Feature | Tall Table | Wide Table |
|---|---|---|
| Layout | One row per tag per sample | One row per event, one column per tag |
| Columns | tag_id, value, quality, t_stamp | t_stamp, batch_id, FT101, TT102 and so on |
| Adding a tag | No schema change | New column needed |
| Best for | Trends and many tags at different rates | Batch reports, shift totals, audits |
| Typical source | Tag history module | Transaction group or script |
A tall table is flexible but grows quickly, since every sample of every tag is a row. A wide table is compact and reads like a report, which is why batch records and shift summaries usually use it, as described in ISA 88 batch control style recipes.
Use proper data types in either SCADA SQL logging layout. A timestamp column should be a datetime type in UTC, values should be REAL or FLOAT, and quality should be a small integer, never long text strings.
Store timestamps in UTC and convert to IST only in reports. This avoids confusion when servers, PLC clocks and cloud tools do not share the same time zone setting.
7 Practical Steps for SCADA SQL Logging
Step five has the biggest effect on size. Logging a slow temperature every second produces many identical rows, so use deadbands and change based logging, the same thinking behind report by exception in telemetry.
Keep the SCADA server clock accurate, or rows from different servers will not line up. A good time source setup is covered in SCADA time synchronisation with NTP and PTP.
Indexing and Query Speed
Most queries against SCADA SQL logging tables ask for one tag or one batch over a time range. A composite index on tag id and timestamp, or on batch id and timestamp, lets the database jump straight to the needed rows instead of scanning the whole table.
Avoid indexing every column, because each index slows every insert. When a slow query appears, check the execution plan first, and read why a SCADA database grows too fast if table size is the real cause.
Storage Sizing Formula
Before choosing hardware or a database edition, estimate how much space SCADA SQL logging will use. For a tall table, multiply tags by rows per day, bytes per row and retention days.
Storage = Rows per day × Bytes per row × Days ÷ 10^9 GB
Example:
200 tags, 10 s interval, 40 bytes per row with index overhead, 365 days
Rows per day = 200 × 86400 ÷ 10 = 1728000
Bytes per day = 1728000 × 40 = 69120000, about 69.1 MB
Storage = 69120000 × 365 ÷ 10^9 = 25.23 GB
The 40 bytes per row figure is an assumption that covers the value, timestamp, tag id, quality and index share. Check real numbers by logging for one day and reading the table size from the database tools.
SQL Storage Calculator
Second Example: Wide Batch Table
Now log the same 200 values as one wide row every 10 seconds, with an 8 byte timestamp and 4 bytes per REAL column. Each row is 8 + 200 × 4 = 808 bytes, and 8640 rows per day give about 6.98 MB per day.
Over 365 days that is about 2.55 GB before index overhead, roughly ten times smaller than the tall layout in this example. For SCADA SQL logging, the trade off is flexibility, since adding a tag means altering the table, which is why good tag planning at the start saves effort later.
Retention and Partitioning
Dream Report notes in its Ignition tech note that the default partition of one month creates a new table every month. It adds that disabling partitioning or using a long period makes reporting simpler, but may slow historical trend updates.
For SCADA SQL logging, the cleanest retention method is to drop whole old partitions instead of running huge DELETE statements. Keep raw data for the period your quality or regulatory team needs, and keep hourly or daily summaries for longer, as in DCS historian data storage.
Dream Report reads Ignition tag history views with its AnyDB structure type and transaction group tables with its Column Item structure type. Reporting tools clearly treat tall and wide layouts as different designs.
SQL Database vs Process Historian
- Open access for Excel, Power BI and MES.
- Free editions of SQL Server, MySQL and PostgreSQL.
- Ideal for batch, shift and event records.
- Joins plant data with orders and lot numbers.
- No native compression for high rate data.
- Needs a DBA mindset for indexes and backups.
- Large tall tables slow down trend queries.
- Schema changes needed for wide tables.
A process historian compresses data and is built for fast trends over thousands of tags at high rates. Many plants use both, with the historian for trends and SCADA SQL logging for batch and quality records, as shown in SCADA historian integration.
Turn on store and forward in your SCADA package before going live. If the database server reboots for updates, data is buffered on the SCADA node and written later instead of being lost.
The buffering concept is explained in store and forward for SCADA and historians, and it matters most when the database sits on another network segment.
Security, Backup and Network Placement
- Use a dedicated SQL login with insert and select rights only.
- Never use the sa account in SCADA connection strings.
- Schedule nightly full and hourly log backups.
- Test a restore at least once a quarter.
- Place report users in the DMZ, not on the control network.
- Monitor disk space and table growth weekly.
- Document every table, column and trigger.
Report users from the business network should read a replica or a database placed in the industrial DMZ, not the server inside the control zone. Wider guidance is in SCADA network security.
Typical Uses in Indian Plants
Dream Report Tech Note on Ignition Logging
SQL Bridge Module Overview Video
SCADA SQL Logging FAQ
It means writing tag values, events and batch data from a SCADA server into a relational database. Standard SQL queries can then pull the data for reports and analysis.
Typical engines are SQL Server, MySQL and PostgreSQL running on a plant server. Reporting tools, MES software and spreadsheets can all read the same tables directly.
Inductive Automation suggests tag history for continuous processes such as water or oil and gas. Each tag is then stored with its own logging rate, deadband and timestamp.
Transaction groups suit discrete and batch work, where many values share one timestamp. They write a single wide row per event into a table that you define.
Log only as fast as the process really changes and use deadbands on slow signals. Avoid storing repeated values every second for slow tags that hardly move at all.
Partition tables by month and drop old partitions on a fixed retention schedule. Keep hourly or daily summaries for long term trends instead of raw samples.
Index the columns used in WHERE clauses, usually tag id or batch id together with the timestamp. A composite index lets the engine jump straight to the needed time range.
Avoid indexing every column, because each index slows inserts and uses extra disk. Check the execution plan of slow queries before adding a new index.
Express is free but limits each database to 10 GB of data. A small plant logging a few hundred tags with sensible rates can often stay within it.
Use the sizing formula to check your case before going live in the plant. Move to a paid edition, MySQL or PostgreSQL when the estimate is too close to the limit.
For batch, shift and event records it often works very well. Plain tables lack built in compression, so high rate trends over thousands of tags grow very large over time.
Many plants therefore run both systems side by side for SCADA SQL logging and trending. The historian handles fast trends while the SQL database holds structured batch and quality records.
Give the SCADA connection its own login with only the rights it needs, and never use the sa account. Schedule regular backups and test a restore every few months.
Keep report users away from the control network by giving them a replica placed in the plant demilitarised zone. Turn on store and forward so database outages do not create gaps in SCADA SQL logging.
Related Articles
- SCADA Database Growing Too Fast
- What Is a Process Historian
- Store and Forward for SCADA Historian
- SCADA Tag Database Design
- DCS Historian Explained, Data Storage
External References
- Using Dream Report with Ignition Data Logging, Dream Report
- Tag History vs Transaction Groups, Inductive Automation
- SCADA, Wikipedia
What We Learn Today
- SCADA SQL logging writes tag values, events and batch records into SQL Server, MySQL or PostgreSQL so standard queries and report tools can use them.
- Tall tables suit many tags at different rates, while wide tables from transaction groups suit batch and shift records with one shared timestamp.
- Index tag or batch id with timestamp, partition by month, size storage before go live and keep SQL Server Express under its 10 GB limit.