
The same vibrating tubes that measure mass flow also act as a precise density sensor, because a heavier fluid makes the tubes swing more slowly. Learn how the meter turns tube frequency into density, how it is calibrated and what spoils the reading.
A Coriolis meter reports density from the natural frequency of its flow tubes, with accuracy that rivals laboratory instruments. This guide covers the physics, calibration with air and water, concentration outputs and the field problems that matter most.
What Is Coriolis Density Measurement?
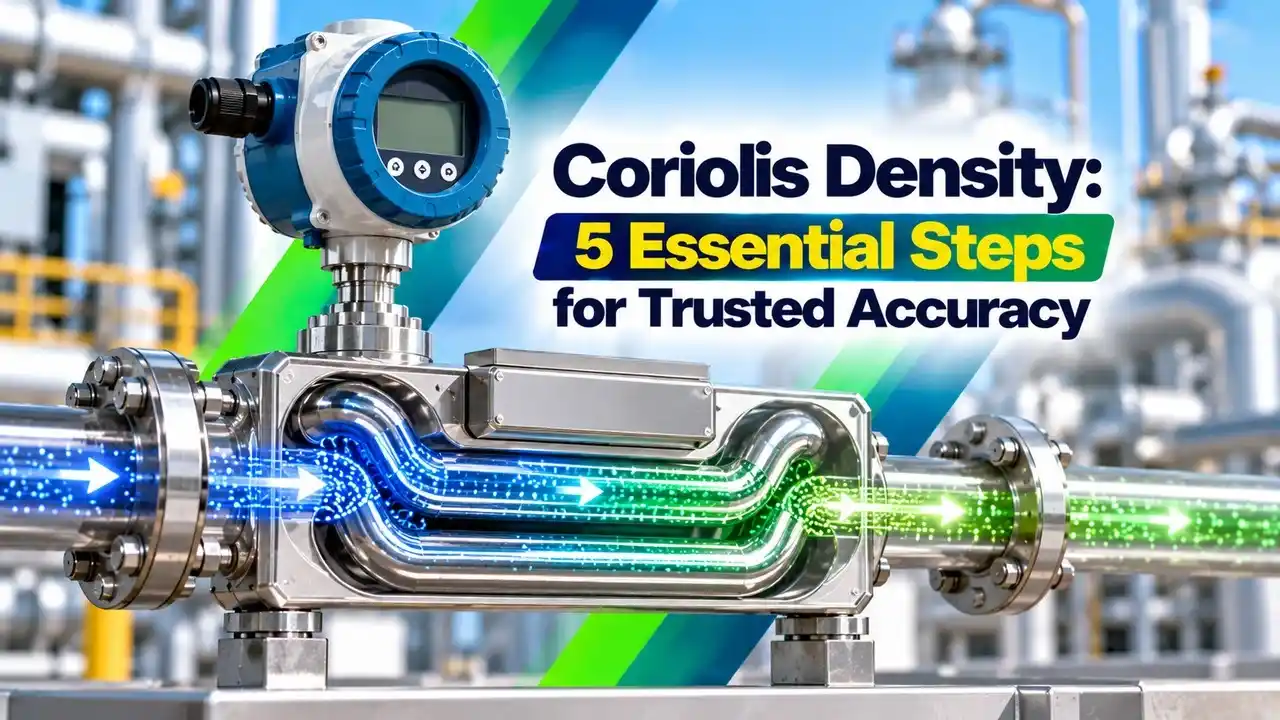
Coriolis density measurement is the use of a Coriolis flow meter as an inline densitometer, where the natural frequency of the vibrating flow tubes reveals the density of the fluid inside them. The meter measures mass flow from the phase shift between its pickoffs and measures density from the drive frequency, both at the same time.
This makes one instrument a mass flowmeter, a density meter and a thermometer, and lets it calculate volume flow as mass divided by density. The difference between these quantities is explained in mass flow and volumetric flow.

Typical uses include sugar and juice concentration, crude oil and product gravity, acid and caustic strength, and interface detection in pipelines. Where tanks are involved, the same density value can also correct a DP level measurement with varying density.
Why Tube Frequency Reveals Coriolis Density
A flow tube behaves like a spring with a mass on it. The spring stiffness comes from the tube metal and geometry, and the mass is the tube itself plus the fluid it carries.
Rearranged: ρ = K1 × τ² minus K2, where τ = 1 ÷ f is the tube period
k is tube stiffness, V is the internal tube volume
K1 and K2 are calibration constants found with two known fluids
Because the tube mass, stiffness and volume are fixed, any change in frequency comes from the fluid. A heavier fluid lowers the frequency and raises the period, and Kyue Instruments describes this as density being proportional to 1 ÷ f².
The transmitter keeps the tubes vibrating at resonance with a small drive coil and tracks the exact frequency many times per second. That is why Coriolis density values respond quickly and need no sample line or laboratory delay.
A meter reporting Coriolis density does not weigh the fluid. It infers density purely from how slowly the filled tubes vibrate, which is why it works in any mounting orientation.
Coriolis Density Accuracy in g/cm³
Emerson states in its Micro Motion ELITE data sheet a liquid density accuracy of plus or minus 0.2 kg per m³ with the premium option and plus or minus 0.5 kg per m³ as standard. It gives a density range up to 5000 kg per m³ on all models.
Kyue Instruments lists plus or minus 0.0005 g/cm³ for its universal series and plus or minus 0.002 g/cm³ for its hygienic series. So the Coriolis density spec depends strongly on the tube design and on whether an enhanced density calibration was ordered.
These figures apply only at reference conditions. Temperature, pressure, coating and gas bubbles add to the total, so build an uncertainty budget as shown in Coriolis flow meter uncertainty calculation before you promise a number to the process team.
When a process needs concentration within tight limits, order the enhanced density calibration from the maker. Its premium accuracy usually costs far less than a separate inline densitometer.
5 Essential Steps of Density Calibration
The air and water method is the standard two point calibration used by most makers. Air near 20 °C has a density of about 0.0012 g/cm³ and pure water about 0.9982 g/cm³, so the two points are far apart and well known.
Factory calibration is done in controlled rigs, and the constants are printed on the tag and stored in the transmitter. A field check against a lab hydrometer or a portable density meter is good practice, with results recorded as in ISO 17025 calibration laboratory requirements.
Example:
τa = 400 µs (air), τw = 430 µs (water), τp = 435 µs (process)
τp² minus τa² = 189225 minus 160000 = 29225
τw² minus τa² = 184900 minus 160000 = 24900
Ratio = 29225 ÷ 24900 = 1.1737
0.9970 × 1.1737 = 1.1702
ρ process = 0.0012 + 1.1702 = 1.1714 g/cm³
Coriolis Density Calculator
The periods in this example are illustrative, since real values depend on tube size and shape. The method itself is exactly how the transmitter computes Coriolis density internally after it applies temperature and pressure corrections.
Temperature and Pressure Effects on the Tubes
Tube stiffness falls as the metal warms, so the frequency and the Coriolis density result would drift even with no change in fluid density. The meter measures tube temperature with an RTD and corrects for this change in the elastic modulus.
High line pressure stiffens the tubes and raises the frequency slightly, so some models accept a pressure input for correction. Emerson notes in its data sheet that the density specification with its optional temperature calibration is valid from about minus 18 to 60 °C, which shows how much temperature range matters.
Process temperature changes density in its own right as well. A fuel at 40 °C is noticeably lighter than the same fuel at 15 °C, so contracts usually refer density to a base temperature.
From Density to Concentration, Brix and API
Many transmitters convert Coriolis density and temperature into concentration using built in curves or user tables. Kyue Instruments lists outputs such as degrees Brix for sugar and percent alcohol, both calculated from density and temperature.
Sugar content of juices, syrups and molasses.
Oil gravity from density referred to 60 °F.
Strength of acids, caustic and brines.
Volume at base conditions from mass and base density.
API gravity is found from specific gravity at 60 °F with API = 141.5 ÷ SG minus 131.5. A related refresher is available in what is specific gravity.
Second Worked Example: Brix and API Gravity
A sugar solution measured at 20 °C shows a Coriolis density of 1.0400 g/cm³. Standard sugar tables give about 10 degrees Brix at this density, so the transmitter would report close to 10 Brix.
A light crude shows an SG of 0.8500 at 60 °F from its Coriolis density and temperature. Then API = 141.5 ÷ 0.85 minus 131.5 = 166.47 minus 131.5 = 34.97, which is a typical medium light crude value.
When you build a custom concentration table, take lab samples across the full working range and at two or more temperatures. A table built from one temperature will drift as the process warms up.
Entrained Gas and Other Coriolis Density Errors
Gas bubbles are the biggest enemy of Coriolis density readings. Bubbles lower the mixture density, damp the tube motion and can move relative to the liquid, which is called decoupling.
Emerson states that low frequency sensors help the two phase mixture vibrate with the tube and reduce the error from entrained gas in liquid flow. In the field, watch the drive gain diagnostic, since a sudden rise usually means air in the tubes, as discussed in Coriolis flow meter troubleshooting.
Coating and erosion change tube mass and stiffness, so they shift Coriolis density before they shift flow. Abrasive slurries and viscous products need special care, and viscosity measurement principles help explain why damping rises with thick fluids.
Installation and Commissioning Checklist
- Mount where the tubes always stay full of liquid.
- Keep the meter low in the line, away from high points.
- Install downstream of pumps, not after a pressure drop that releases gas.
- Support pipes on both sides to avoid stress on the sensor.
- Enter air and water constants from the tag and verify them.
- Check density at zero flow with a known liquid.
- Record drive gain and tube frequency as baseline values.
- Set alarms on drive gain to warn of gas or coating.
Install control valves downstream so back pressure keeps dissolved gas in solution and the Coriolis density reading stays steady. If the meter feeds a DCS, map density, temperature and drive gain over HART or a digital bus so the diagnostics are visible to operators.
- Inline density with no sampling delay.
- Very high accuracy with enhanced calibration.
- Same instrument gives mass flow and temperature.
- Direct concentration, Brix and API outputs.
- Sensitive to entrained gas and bubbles.
- Coating and erosion shift calibration.
- Higher cost than a simple volumetric meter.
- Large sizes are heavy and costly.
Verification and Maintenance Practice
Many plants verify Coriolis density every year against a lab sample and adjust the density offset if the error is outside tolerance. Choose the interval from history, as explained in calibration interval determination.
Built in verification tools from major makers check tube stiffness without removing the meter. A stiffness change warns of coating or erosion long before it causes a large error, which complements regular measurement uncertainty analysis in the lab.
For hygienic lines, run clean in place cycles at the specified temperature and check density with water after cleaning. A shift in the water reading points to residue left in the tubes.
Micro Motion ELITE Data Sheet
Coriolis Density in One Minute Video
Coriolis Density FAQ
The flow tubes vibrate at their natural frequency, and that frequency falls as the fluid inside gets heavier. The transmitter converts the measured tube period into density with two calibration constants.
It also corrects for tube temperature and sometimes for line pressure. The result is a live density value that updates many times every second without any sample line.
Emerson lists plus or minus 0.0002 g/cm³ for its premium ELITE liquid density option and 0.0005 g/cm³ as standard. Other makers quote about 0.0005 to 0.002 g/cm³ depending on the series.
These values hold at reference conditions only, with clean tubes and stable temperature. Gas bubbles, coating and temperature changes add to the uncertainty in a real installation.
Both fluids are easy to obtain and their densities are known very well at a given temperature. Air is near 0.0012 g/cm³ and water near 0.9982 g/cm³ at 20 degrees.
The two points are far apart, which makes the slope of the calibration line accurate. A third fluid close to the process density is then used for verification.
Gas bubbles reduce the mixture density and can move relative to the liquid inside the tubes. This decoupling and extra damping cause low and noisy Coriolis density values on the display.
A rise in drive gain is the usual warning sign. Improve back pressure, avoid high points and keep the tubes full to reduce the effect.
Yes, most transmitters convert density and temperature into Brix, API gravity, percent by mass or standard volume. The conversion uses built in tables or a custom matrix entered by the user.
Accuracy of the concentration output depends mainly on the quality of that table. Build it from lab samples covering the full working range and temperatures.
Many plants verify once a year against a lab sample or reference meter, and more often in coating or abrasive service. The interval should follow the calibration history of that meter.
Built in tube stiffness checks help spot drift between visits. A water check after cleaning is a quick and useful extra test for hygienic food lines.
No, the density result comes from tube frequency and is not sensitive to the flow profile. Straight pipe therefore matters very little for this measurement in practice.
What matters more is keeping the tubes full and free of gas. Mount the meter low in the line and keep pipe stress away from the sensor body.
Related Articles
- Coriolis Flow Meter Working Principle
- Coriolis Flow Meter Troubleshooting
- Coriolis Flow Meter Uncertainty Calculation
- What Is Specific Gravity
- DP Level Measurement With Varying Density
External References
- Micro Motion ELITE Coriolis Flow and Density Meters, Emerson
- Coriolis Mass Flowmeter Guide, Kyue Instruments
- Mass Flow Meter, Wikipedia
What We Learn Today
- Coriolis density comes from the natural frequency of the flow tubes, which falls as the fluid inside becomes heavier and the tube period rises.
- Makers calibrate density with two known fluids, usually air and water, then verify with a third fluid close to the process density.
- Entrained gas, coating, temperature and pressure are the main error sources, and drive gain is the key diagnostic to watch in service.