
A few parts per million of oil can foul a boiler, breach a discharge permit or reveal a leaking heat exchanger long before anyone sees a sheen. An online analyzer turns that hidden risk into a live, trendable number in the control room.
Refineries, offshore platforms, power plants and effluent plants all need to know how much oil is in their water. This guide explains how an oil in water analyzer measures it, where to install it and how to keep it accurate.
What Is an Oil in Water Analyzer?
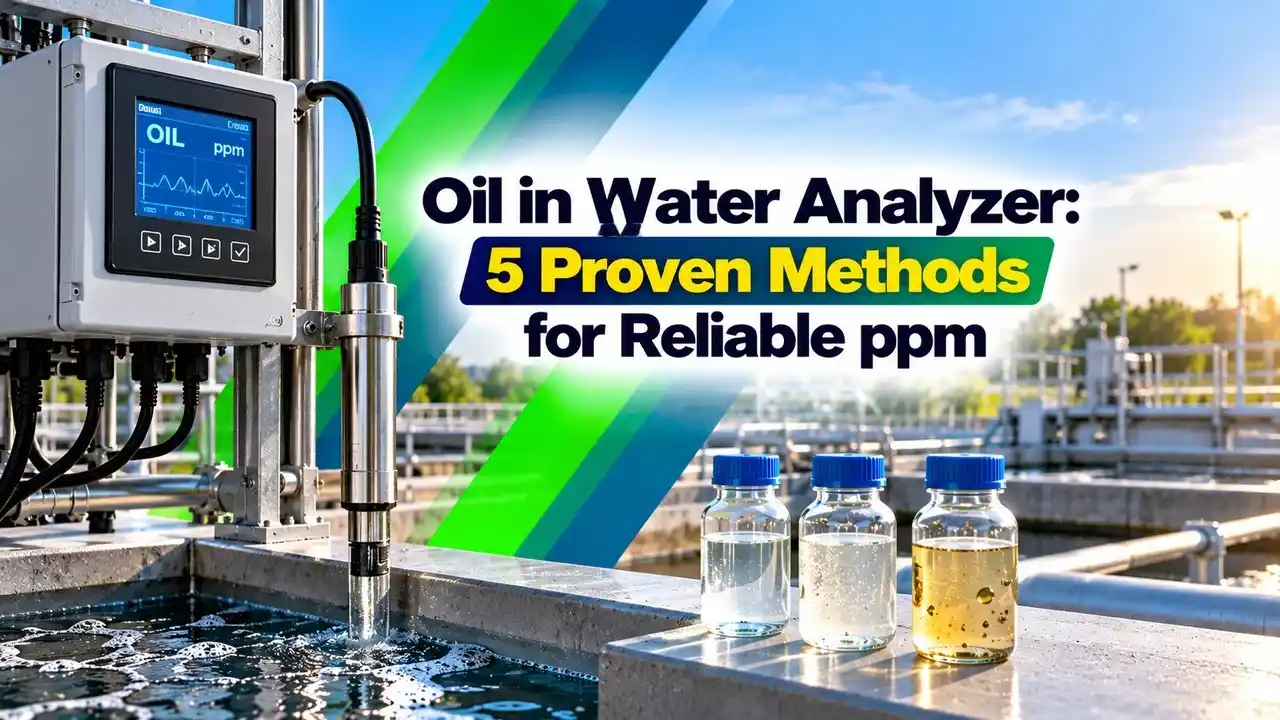
An oil in water analyzer is an online or laboratory instrument that measures the concentration of hydrocarbons dispersed or dissolved in water, usually in ppm or mg/L. It is one of the most common analytical measurements in oil and gas, refining, power and wastewater plants.
The reading protects two things at once: the environment, by proving that discharged water meets its permit, and the plant, by warning when oil enters condensate, cooling water or boiler feed. For water, 1 mg/L and 1 ppm are practically the same, so both units appear on datasheets.

Unlike a lab test that gives one number per shift, an online unit updates every few seconds and sends a 4 to 20 mA signal and alarm relays to the DCS.
Why Plants Measure Oil in Water
According to the Arjay Engineering guide to oil in water monitoring, produced water discharged to open sea is limited to 30 mg/L, or 29 mg/L in the Gulf of Mexico. Land based discharges are typically held near 15 mg/L, while some inland waterways allow as little as 5 mg/L.
Rivertrace explains that under MARPOL Annex I every vessel above 400 gross tonnage must treat bilge water to a maximum of 15 ppm before discharge. Canadian rules on the Great Lakes are stricter at 5 ppm.
In India, the general effluent standards under the Environment Protection Rules allow 10 mg/L of oil and grease for discharge into inland surface water. Plants that also run continuous emission monitoring often add oil in water to the same online compliance network.
OSPAR adopted a gas chromatography method with flame ionisation detection as its reference in 2003. It extracts the oil with pentane and counts hydrocarbons from C7 to C40, so online analyzers are correlated against it.
5 Proven Methods to Measure Oil in Water
Excites aromatic hydrocarbons with ultraviolet light and measures the longer wavelength light they emit.
Measures absorption at 3.4 µm by carbon to hydrogen bonds, usually after solvent extraction.
Measures light scattered by dispersed oil droplets, a form of nephelometry.
A camera and microscope count and size droplets and separate them from solids and gas.
Solvent extraction followed by gas chromatography, the OSPAR reference.
The Arjay guide notes that infrared absorption at 3.4 µm responds to the total number of carbon to hydrogen bonds, which is why it was historically dominant. It is the same physics used in an NDIR gas analyzer, applied to an extracted liquid sample.
Light scattering is cheap and robust but cannot tell an oil droplet from a sand grain or a gas bubble, much like a turbidity meter. The same guide states it only works well when droplets are larger than about 2 µm.
How a UV Fluorescence Oil in Water Analyzer Works
Arjay explains that its HydroSense and FluoroCheck sensors aim light at one wavelength and measure the emitted light at a higher wavelength at the same moment. Aromatic hydrocarbons with chain lengths from C6 to C36 fluoresce in the bands they monitor.
Benchmark Measurement Solutions describes deep UV fluorescence in the 200 to 300 nm range, with online ranges from below 1 ppm to about 6000 ppm. Solids and gas bubbles do not fluoresce, so the method shrugs off most false readings that trouble scattering sensors.
F sample = fluorescence signal of the process water
F blank = signal of oil free water from the same source
k = calibration factor, ppm per signal unit, set with the site oil
Example:
F sample = 1450 counts, F blank = 250 counts, k = 0.02 ppm per count
Oil = 0.02 × (1450 minus 250) = 24 ppm
Always calibrate a fluorescence oil in water analyzer with the oil actually present in your stream. A factor set with a generic standard can be off by a large margin on a different crude.
Oil Discharge Load Formula
Permits often limit both concentration and total quantity, so engineers convert the analyzer reading into a daily oil load. Because 1 mg/L equals 1 g per cubic metre, the conversion is simple.
Percent of limit = C ÷ limit × 100
C = oil concentration, mg/L
Q = water flow, m³/h
Example:
C = 25 mg/L, Q = 400 m³/h, limit = 30 mg/L
Load = 25 × 400 × 24 ÷ 1000 = 240 kg per day
Percent of limit = 25 ÷ 30 × 100 = 83.3 percent
Oil Discharge Load Calculator
Second Worked Example: Condensate Return
A refinery returns 50 m³/h of steam condensate to its boilers, and the analyzer shows 2 ppm after a heat exchanger tube leak. The load is 2 × 50 × 24 ÷ 1000 = 2.4 kg of oil per day heading into the boiler feed system.
That small mass coats tubes, causes foaming and carryover, and can lead to overheating, so the condensate should be dumped until the leak is isolated. A leaking plate heat exchanger is a frequent source in such cases.
Turner Designs lists cooling water, steam condensate, boiler feed and produced water among the main uses of its fluorescence oil monitors. Their portable units span roughly 5 ppb to 5000 ppm depending on the oil.
Where Oil in Water Monitoring Is Used
In a power plant the oil reading sits beside conductivity and TOC analyzers on the condensate panel. Each one catches a different contaminant, so none replaces the others.
At an effluent treatment plant, oil readings support other online checks such as residual chlorine and pH at the outfall. Together they give a complete picture for the pollution control board.
Installing the Analyzer Correctly
Free oil rises and solids settle, so a top or bottom tap gives a reading that is too high or too low. Good practice for sample lines is the same as for any online analyzer system: fast loop, minimum dead volume and a return to process.
Arjay states its HydroSense 2410 suits Div 2 and Zone 2 or general purpose locations, which lets operators clean it without a gas free permit. For Zone 1 locations check the hazardous area classification and pick a flameproof or purged design.
Install a sample isolation valve and a flush water connection at the analyzer. A quick flush before cleaning removes oil film and makes the zero check far more repeatable.
Cleaning, Calibration and Verification
Optical windows foul with oil, biofilm and scale, and a dirty window slowly lowers or raises the reading depending on the method. The Arjay guide suggests a daily wipe for the first week, then every two days, and stretching the interval only while the readings stay stable.
- Wipe or auto clean the optical window on schedule.
- Check the zero with oil free water from the same source.
- Verify span with a standard of the site oil.
- Compare against a laboratory GC or IR result monthly.
- Check sample flow, pressure and drain.
- Inspect the UV lamp or LED hours and intensity.
- Record as found and as left values.
Arjay calibrates on line under normal flow, using process water so that the background signal is included automatically. Grab samples analysed in the laboratory are then used to correlate the online factor, and the measurement uncertainty of that lab method limits the final accuracy.
Selecting an Oil in Water Analyzer
| Need | Best Method | Typical Range | Watch Out For |
|---|---|---|---|
| Condensate and boiler feed | UV fluorescence | Below 1 to 50 ppm | Non aromatic oils |
| Produced water discharge | UV fluorescence or imaging | 1 to 1000 ppm | Crude changes |
| Gross separator upset | Light scattering | 10 to 5000 ppm | Solids and bubbles |
| Permit and lab check | IR or GC FID | Lab range | Solvent handling |
| Marine bilge | Scattering or fluorescence | 0 to 30 ppm | Type approval |
Choose a range where the normal reading sits near one third of full scale. The Arjay HydroSense 2410 range is selectable from 0 to 10 ppm up to 0 to 5000 ppm.
- Continuous reading instead of one sample per shift.
- Fast alarm protects boilers and outfalls.
- Fluorescence ignores most solids and gas.
- Trend helps tune separators and flotation units.
- Reading depends on the type of oil.
- Optics foul and need regular cleaning.
- Needs correlation with a lab reference.
- Sample point errors are common.
Troubleshooting Oil in Water Readings
A reading that drifts upward with no process change usually means a fouled window or oil film in the sample line. A sudden zero with oil known to be present usually means a blocked sample line.
Arjay Guide to Oil in Water Monitoring
Online Oil in Water Analyzer Video
Oil in Water Analyzer FAQ
It measures the concentration of hydrocarbons that are dispersed or dissolved in a flowing water stream. The result is shown in ppm or mg/L, and for water these two units are almost exactly equal.
Online units send the value to the DCS as a live 4 to 20 mA signal with alarm relays. Laboratory units measure grab samples and are mainly used to verify the online readings.
UV fluorescence is the most widely used method for continuous online monitoring today. It detects aromatic hydrocarbons at low ppm levels and ignores most suspended solids and gas bubbles in the sample.
Infrared absorption at 3.4 µm remains common in laboratories and portable test kits. Light scattering is cheaper and simpler, but it cannot tell oil droplets from sand grains or bubbles.
The Arjay guide quotes a limit of 30 mg/L for produced water discharged to the open sea. It gives a slightly lower figure of 29 mg/L for the Gulf of Mexico region.
OSPAR uses gas chromatography with flame ionisation detection as its laboratory reference method. Online analyzers on platforms are therefore correlated against that slower but more defensible laboratory result.
Fluorescence intensity depends on how many aromatic molecules the particular oil contains. A light condensate and a heavy crude can give very different signals at exactly the same concentration in water.
Using the actual process oil keeps the calibration factor realistic and the reading trustworthy. Recheck the factor whenever the crude source, the blend or the condensate type changes in the plant.
Arjay suggests a daily wipe of the optical flow plate for the first week of service, then every two days. Stretch the interval further only while readings stay stable between two cleanings.
Many modern analyzers include automatic wipers or ultrasonic cleaning to reduce manual visits. These features cut the routine work but still need periodic inspection and a zero check with clean water.
Take the sample from the side of a well mixed pipe section, ideally downstream of a bend or a pump. Free oil collects at the top of a line and solids settle to its bottom.
Keep the sample tubing short and smooth so that oil does not stick to the walls. Provide enough flow, at least 1 L/min for the Arjay sensor, and a free draining outlet.
Usually no, because the measuring ranges and the oil types in these two streams are very different. Condensate needs sensitivity well below 1 ppm, while effluent can reach hundreds of ppm during an upset.
Most plants therefore install a dedicated analyzer for each duty with its own sample system. Each unit is then ranged, calibrated and alarmed for the specific stream it protects.
Related Articles
- Turbidity Measurement Guide
- TOC Analyzer Working Principle
- Conductivity Sensor Working
- Residual Chlorine Analyzer Working
- Gas Chromatograph Basics
External References
- Oil in Water Monitoring for Environmental Compliance, Arjay Engineering
- Understanding Oil in Water Monitoring, Rivertrace
- Produced Water, Wikipedia
What We Learn Today
- An oil in water analyzer reports hydrocarbons in ppm or mg/L, and UV fluorescence is the most common online method because solids and bubbles do not fluoresce.
- Produced water discharged to open sea is limited to 30 mg/L under OSPAR, while MARPOL limits ship bilge discharge to 15 ppm.
- Daily oil load in kg equals concentration in mg/L times flow in cubic metres per hour times 24, divided by 1000.