
Loose lugs and overloaded breakers warn you with heat long before they fail, and a thermal camera lets you see that warning.
A thermal camera turns invisible heat into a colour image, showing connections and components that run hotter than they should. It is one of the fastest predictive maintenance tools for switchboards and MCCs.
What Is Infrared Thermography?
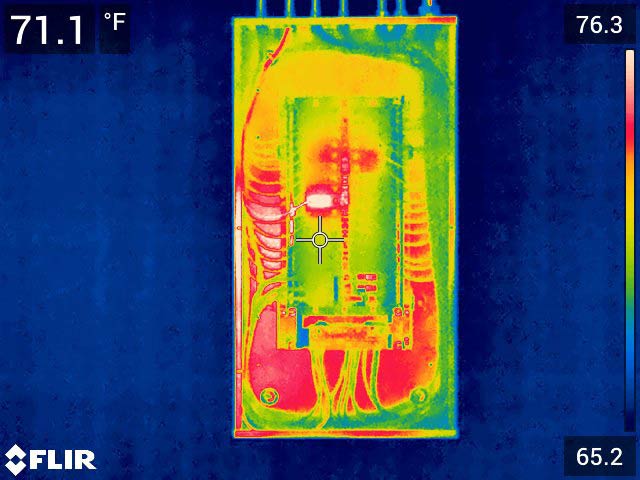
Infrared thermography is a non contact method that measures the infrared energy emitted by surfaces and displays it as a temperature image. In electrical work it reveals high resistance joints, overloads and imbalance while equipment runs under load.
Brady describes the output as a heat map in which hot spots stand out clearly against cooler parts. The technician then compares similar components to spot the odd one out.
Heat follows I²R, so a small rise in joint resistance produces a large rise in temperature. The same law drives cable ampacity limits.
Brady also notes that NFPA 70B, 2023 edition, now requires infrared thermography as part of an electrical maintenance program. Many insurers ask for an annual survey report.
Why Panels Develop Hot Spots
Harmonic heating of neutrals is covered in power harmonics. Motor starters also show wear in thermal overload relays and contactor tips.
Most faults found are connection problems, which are cheap to fix when caught early. Left alone, they can end in arcing and fire.
6 Expert Infrared Thermography Steps
Opening a live panel exposes the thermographer to arc flash hazards. Follow NFPA 70E and the right PPE selection.
With IR windows installed in panel doors, infrared thermography can be done without removing covers. Brady notes a whole panel can then be surveyed in minutes.
Severity by Temperature Rise
| Delta T vs Similar Part | Delta T vs Ambient | NETA Action |
|---|---|---|
| 1 to 3 °C | 1 to 10 °C | Possible deficiency, investigate |
| 4 to 15 °C | 11 to 20 °C | Probable deficiency, repair when possible |
| Not applicable | 21 to 40 °C | Monitor and repair soon |
| Above 15 °C | Above 40 °C | Major discrepancy, repair immediately |
These bands follow the NETA maintenance testing guidance used in the Fluke application note. Comparing against a similar part under similar load is more reliable than comparing with ambient air.
Always record the load current at the time of the scan. A modest rise at light load can become severe at full load.
A good infrared thermography report lists the panel, component, load, temperatures, image and action for every finding. Trending these reports year after year shows which panels need more attention.
Emissivity and Load Correction
Worked example:
Hot lug 68 °C, similar lug 40 °C, Delta T = 28 °C
Load at scan = 60 percent of rated
Delta T corrected = 28 × (1 ÷ 0.6)² = 78 °C
Grade as major discrepancy and repair immediately
Bare copper and aluminium have very low emissivity, often below 0.1, so they read far cooler than they are. Painted surfaces, insulation and electrical tape sit near 0.95 and read accurately.
The square law is an approximation, and some guides use an exponent between 1.6 and 2. Heat transfer through materials is explained in thermal conductivity.
Where to Use Infrared Thermography
Incomers, busbars and outgoing breakers.
Starters, contactors and overloads.
Bushings, cooling fins and terminations.
Lugs and glands on large feeders.
MCCs usually give the most findings per hour, see motor control center. Busbar joints are another hot spot, sized as in busbar sizing.
Load Corrected Delta T Calculator
Treat this as a screening aid, and follow your site severity criteria for final decisions. Retest after repair to confirm the fix.
- Non contact and fast.
- Finds faults before failure.
- No shutdown needed.
- Supports NFPA 70B compliance.
- Needs adequate load.
- Shiny surfaces mislead readings.
- Hidden joints cannot be seen.
- Arc flash exposure when covers are open.
Fluke Thermal Imaging Guide PDF
Thermal Imaging for Electrical Work Video
Infrared Thermography FAQ
Related Articles
- NFPA 70E Electrical Safety
- What Is Arc Flash
- Electrical Safety PPE Selection
- Motor Control Center Explained
- Busbar Sizing Calculation
External References
- Electrical Inspections Using Thermal Imaging, Fluke
- Thermography for Electrical Inspection, Brady
- Thermography, Wikipedia
What We Learn Today
- Heat from I²R reveals loose joints and overloads early.
- Grade findings by Delta T against similar parts under load.
- Safe infrared thermography needs PPE, correct emissivity and records.