
On a damp night, high voltage lines hiss, crackle and sometimes show a faint violet glow around the conductors. That is air breaking down near the wire, and this guide explains why it happens, how to calculate its onset and how designers keep it small.
The corona effect wastes power, creates noise and disturbs radio signals near high voltage lines. Learn the physics, the Peek formulas, the factors that matter and the design methods that control it.
What Is the Corona Effect?
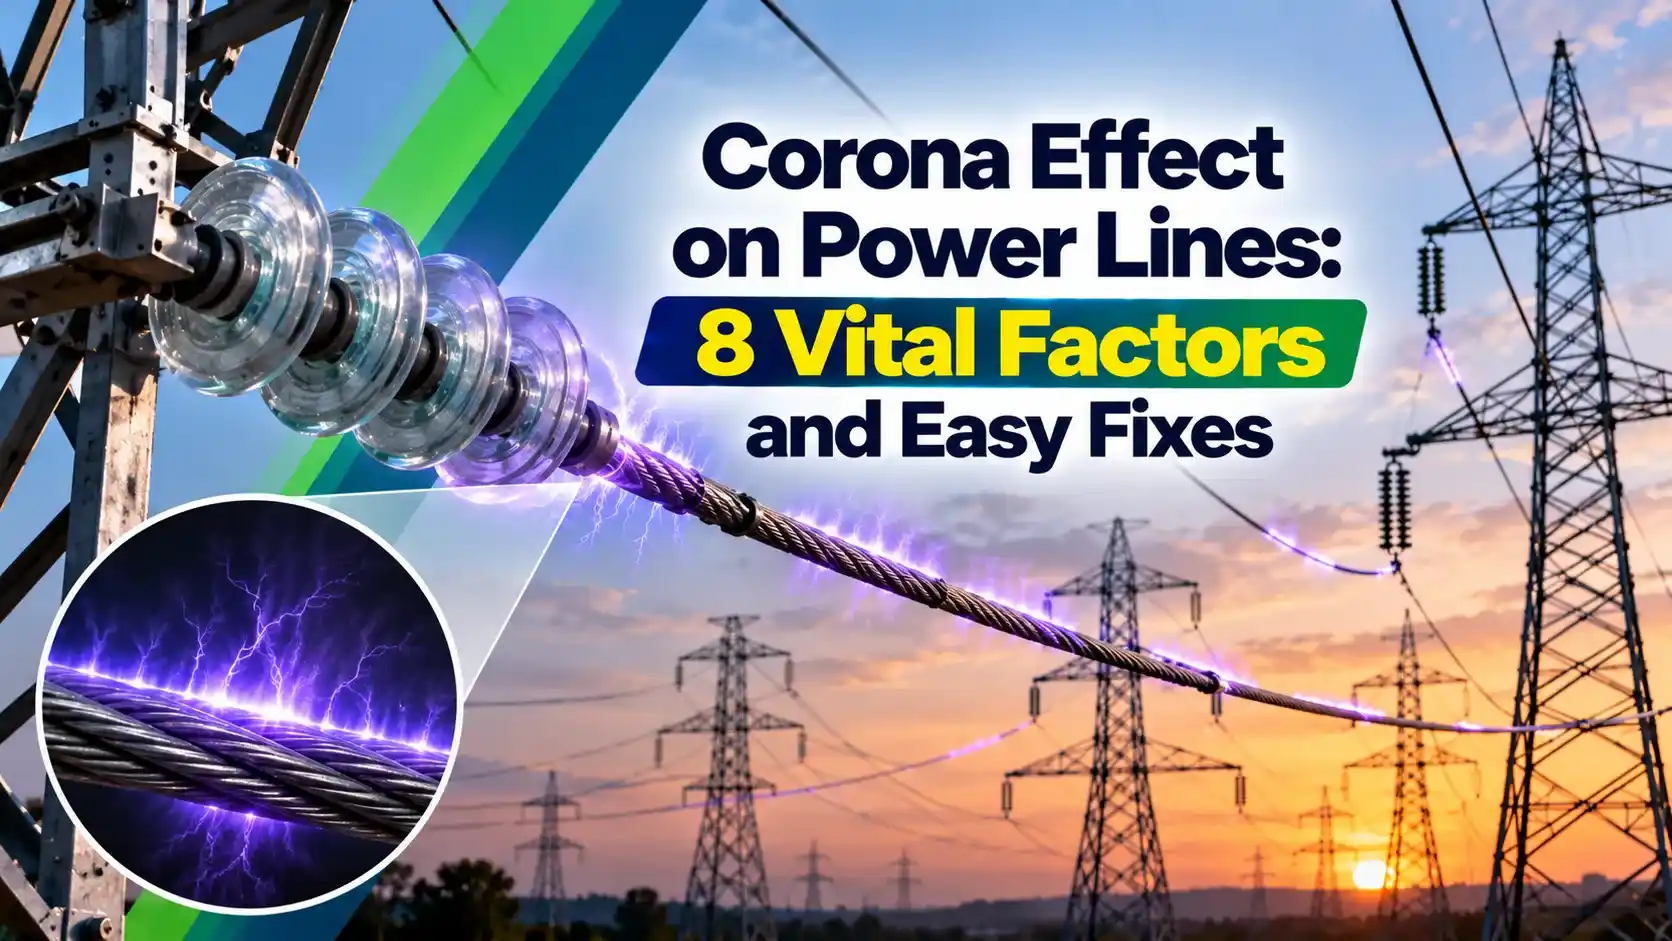
The corona effect is the partial ionisation of the air around a high voltage conductor when the electric field at its surface exceeds the breakdown strength of air. The air close to the wire becomes conducting, producing a faint glow, a hissing sound, ozone and a small but continuous power loss.
Air is normally a good electrical insulation between line conductors. Near a thin conductor, however, the field is concentrated, so the air breaks down locally while the rest of the gap still insulates, which is why corona is a partial discharge and not a flashover.
A few free electrons always exist in air because of cosmic rays and natural radioactivity. In a strong field they gain enough energy to knock more electrons out of gas molecules, and this electron avalanche is the start of the corona effect.
How Corona Starts Around a Conductor
EE Power notes that the threshold for corona formation is typically about 30 kV per cm in dry air, which equals about 21.2 kV per cm rms. The field falls quickly with distance, so the ionised layer stays as a thin sheath around the conductor, much like the charge distribution described in capacitance between two wires.
On AC lines, the corona effect appears in each half cycle when the voltage is near its peak. In the positive half cycle the glow is fairly uniform, while in the negative half cycle it forms as small reddish spots or beads along the conductor.
The corona effect is visible more easily on the negative half cycle as separate beads, because negative corona forms at points of roughness on the conductor surface. A camera that records ultraviolet light can see corona even in daylight.
Critical Disruptive Voltage and Peek Formula
The critical disruptive voltage is the phase voltage at which the corona effect begins, because the conductor surface gradient just reaches the breakdown strength of air. Above it, the corona effect starts, although the glow becomes visible only at a somewhat higher visual critical voltage.
g0 = 21.2 kV per cm rms, δ = 3.92 b ÷ (273 + t)
m0 = 1 polished, 0.92 to 0.98 rough, 0.8 to 0.87 stranded
Visual: Vv = mv × δ × g0 × r × (1 + 0.3 ÷ √(δ r)) × ln(d ÷ r)
Example:
r = 1.5 cm, d = 700 cm, m0 = 0.85, t = 25 °C, b = 76 cm Hg
δ = 3.92 × 76 ÷ 298 = 1.000
ln(700 ÷ 1.5) = ln(466.7) = 6.146
Vc = 0.85 × 1.000 × 21.2 × 1.5 × 6.146 = 166.07 kV
Line value = 1.732 × 166.07 = 287.64 kV
The lecture notes of Veer Surendra Sai University of Technology, Burla give exactly this form, with g0 equal to 21.2 kV per cm rms and m0 between 0.8 and 0.87 for stranded conductors. In the example, a 220 kV line has a phase voltage of 127 kV, well below 166 kV, so fair weather corona effect is small.
Here r is the conductor radius and d the spacing between conductors, both in cm. For unequal spacing use the geometric mean distance, the same idea used for line inductance, and keep values in the per unit system when you compare lines of different voltage.
Corona Effect Calculator
For foul weather, multiply the fair weather Vc by about 0.8. If the operating phase voltage comes close to that reduced value, expect noticeable loss and noise in rain and fog.
Peek Formula for Corona Effect Power Loss
Example, 132 kV line in foul weather:
r = 0.75 cm, d = 250 cm, m0 = 0.85, δ = 1, f = 50 Hz
Fair weather Vc = 0.85 × 21.2 × 0.75 × ln(333.3) = 78.51 kV
Foul weather Vc = 0.8 × 78.51 = 62.81 kV
V = 132 ÷ 1.732 = 76.21 kV, so V minus Vc = 13.40 kV
P = 241 × 75 × 0.0548 × 13.40² ÷ 100000 = 1.78 kW per km per phase
For three phases this is about 5.33 kW per km, or about 533 kW over a 100 km route, but only while it rains. In fair weather the same line is below its critical voltage and the corona effect loss is almost zero, which shows how strongly weather controls the result.
Peek developed this empirical formula for losses that are well above onset, and it overestimates small losses close to Vc. For such cases engineers use the Peterson formula or measured data, and modern design tools work from conductor surface gradient directly.
8 Vital Factors Affecting the Corona Effect
Air density matters a lot for lines in the hills of India, because pressure falls with altitude and δ falls with it. A line built at high altitude needs a larger conductor or bundle for the same corona effect performance as a line on the plains.
EE Power reports that lines above 220 kV almost always need special corona control, and that corona loss is typically under 1 percent on well designed lines. Most of the energy loss happens in bad weather, so annual averages are much lower than the worst case figures.
Water droplets on a conductor distort the local field and act as tiny sharp points. That is why a line that is silent on a dry afternoon can crackle loudly during a light drizzle.
Noise, Radio Interference and Ozone From the Corona Effect
EE Power notes that corona produces audible noise in the range of about 1 to 20 kHz, heard as a crackle or hiss, plus a low hum at twice supply frequency. The same discharges generate radio interference in the medium and high frequency bands, a form of electromagnetic interference that can disturb AM radio and power line carrier links.
High energy electrons also split oxygen and nitrogen molecules, forming ozone and nitrogen oxides. With moisture these become corrosive and slowly attack fittings and polymer insulators, and the discharge current is non sinusoidal, adding small power harmonics to the line current.
Methods to Reduce the Corona Effect on EHV Lines
EE Power notes that bundled conductors are standard at EHV levels of 345 kV and above. In India, 400 kV lines commonly use twin ACSR Moose bundles and 765 kV lines use four or six subconductors, which keeps the corona effect and audible noise within limits while also reducing line reactance and the Ferranti effect margin needed.
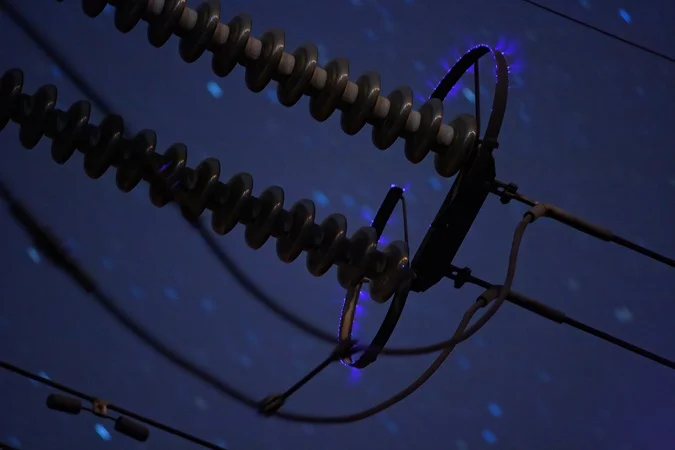
Corona rings are also fitted on surge arresters, bushings and instrument transformers in EHV yards, and GIS substations avoid air corona entirely by enclosing conductors in SF6 gas.
When a new line is noisy, check for damaged strands, missing spacers and bird droppings near clamps before blaming the design. Small surface defects often create most of the corona effect on a fresh line.
- Acts as a safety valve that reduces the steepness of travelling surges.
- Raises effective conductor diameter during surges.
- Lowers stress on insulation from lightning surges.
- Gives early warning of damaged hardware.
- Continuous power loss, high in bad weather.
- Audible noise near homes and roads.
- Radio and carrier interference.
- Ozone and corrosion of fittings and insulators.
The surge damping benefit is real but limited, so lines still rely on shield wires and arresters designed as in lightning protection practice. Engineers never plan on corona as a protection device.
Detecting the Corona Effect in the Field
- Patrol at night or in early morning mist to see or hear discharges.
- Use a daylight ultraviolet corona camera on lines and yards.
- Use an ultrasonic detector to locate crackling hardware.
- Follow up with an infrared scan for hot joints.
- Inspect insulators for white powder and surface tracking.
- Record weather, humidity and voltage with each finding.
Infrared cameras show heating from loose joints, while ultraviolet cameras show corona, so the two methods complement each other as in infrared thermography. Severe tracking on insulators should be followed by an insulation resistance test during the next shutdown.
Corona on DC Lines and Substations
HVDC lines also experience corona, but the space charge drifts away from the conductor and creates ion currents to the ground. Substation design uses the same principles, and the single line diagram of an EHV yard shows where corona rings and grading devices are specified.
University Lecture Notes PDF
Video on Corona in Transmission Lines
Corona Effect FAQ
It is the partial ionisation of air around a high voltage conductor when the surface field exceeds the breakdown strength of air. It shows as a faint violet glow, a hiss and ozone smell.
It wastes energy and creates noise and radio interference. It is controlled by using larger or bundled conductors and smooth hardware.
It is the phase voltage at which the conductor surface gradient reaches the breakdown strength of air. Peek gave it as Vc equals m0 times δ times g0 times r times ln(d ÷ r).
With g0 equal to 21.2 kV per cm rms, r of 1.5 cm and d of 700 cm, Vc is about 166 kV per phase. That corresponds to about 288 kV line to line.
It is the higher voltage at which the corona glow becomes visible to the eye. It includes an extra factor of one plus 0.3 divided by the square root of δ times r.
Between the disruptive and visual voltages, ionisation exists but cannot be seen. Loss and radio noise can therefore start before any glow appears.
Water droplets on the conductor act as sharp points and strengthen the corona effect by distorting the local field. The effective critical voltage falls to about 80 percent of the fair weather value.
Loss depends on the square of voltage above the critical value, so it rises steeply. A line with almost no fair weather loss can lose several kilowatts per km in heavy rain.
Several subconductors spaced apart behave like a single conductor of much larger radius. The surface gradient on each subconductor therefore falls well below the breakdown level of air.
Bundling also reduces line reactance and raises the power transfer capacity. That is why 400 kV and 765 kV lines in India use bundles of two, four or six subconductors.
Yes, it acts as a safety valve for steep travelling surges, because the extra losses damp the wave front. The surge stress on insulation and equipment is reduced slightly as a result.
The benefit is small compared with the costs of loss, noise and interference. Lines are never designed to rely on corona for surge protection.
Night patrols can spot glow and hear crackling near faulty hardware on the line. Ultraviolet corona cameras locate discharges even in bright daylight from the ground.
Ultrasonic detectors pinpoint the source of the corona effect by its sound at close range. Infrared scans are added to find hot joints that often appear together with discharge.
Related Articles
- Ferranti Effect in Transmission Lines
- Skin Effect in Conductors
- Surge Arrester Working and Selection
- GIS vs AIS Substation
- What Is Electromagnetic Interference EMI
External References
- Lecture Notes on Power System Engineering II, VSSUT Burla
- Understanding Corona Discharge in High Voltage Transmission Lines, EE Power
- Corona Discharge, Wikipedia
What We Learn Today
- The corona effect starts when the conductor surface field reaches about 30 kV per cm peak, or 21.2 kV per cm rms, in dry air.
- Peek gave the critical disruptive voltage as m0 times δ times g0 times r times ln(d ÷ r), and corona loss rises with the square of excess voltage.
- Larger conductors, bundled subconductors, wider spacing, smooth hardware and corona rings keep loss, noise and radio interference within acceptable limits.