
A device certificate alone never proves a safety loop is safe enough.
These twelve steps are what a real verification calculation checks before that loop is ever installed.
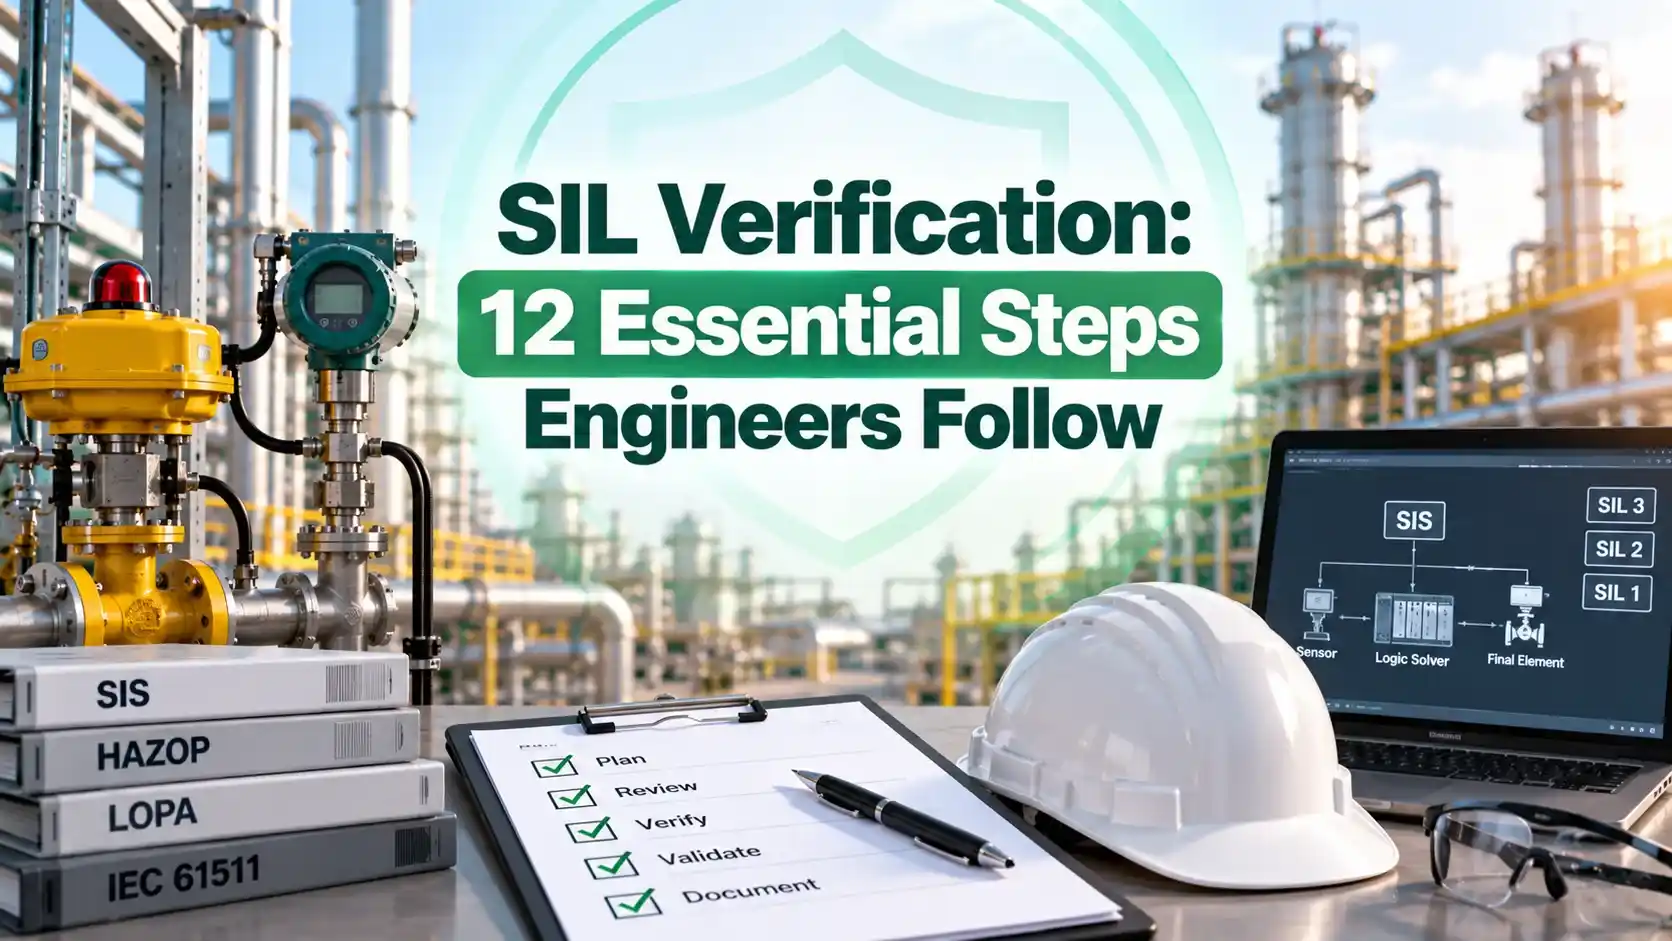
SIL Verification proves, with real failure rate numbers, that a safety instrumented function will actually deliver the safety integrity level it was assigned.
We will cover device classification, the three failure categories, hardware fault tolerance, voting architecture, PFDavg math, and what to do when a calculation falls short.
What Is SIL Verification
SIL Verification is the fourth phase of the IEC 61511 safety life cycle.
Before this stage, a team has already run a hazard and risk analysis, assigned a target safety integrity level, and written a safety requirement specification describing what the loop must do.
This is where those decisions get tested against arithmetic. The engineer pulls real failure rate data for the actual sensor, logic solver and final element chosen for the loop, then calculates whether the completed loop meets the required probability of failure on demand.
If the numbers pass, the design proceeds. If they fail, something in the architecture, the device selection or the proof test interval has to change first.
12 Steps a Complete SIL Verification Covers
A real verification report walks through the same twelve checks every time, regardless of which safety instrumented function is being reviewed.
Type A and Type B Devices in SIL Verification
IEC 61508 sorts every device into one of two categories before any failure rate math starts, since the standard allows a more generous route for devices whose failure behavior is fully understood.
Type A Devices
Simple components with well understood failure modes, such as a relay, a solenoid valve, an RTD, a thermocouple, or a mechanical limit switch.
Type B Devices
Complex components containing software or an unclear failure mode, such as a smart transmitter, a valve positioner, a PLC, or a DCS module.
Failure Categories Used in SIL Verification
Every device failure this calculation considers falls into exactly one of three buckets, and the size of each bucket drives both the safe failure fraction and the final PFDavg number.
Voting Architecture and Hardware Fault Tolerance
Voting architecture is written as X out of Y, meaning X channels must agree for the safety function to act, out of Y channels installed.
Hardware fault tolerance is simply how many of those channels can fail before the safety function is actually lost.
HFT equals Y minus X
Example one, 1oo1 colon HFT equals 1 minus 1 equals 0
Example two, 1oo2 colon HFT equals 2 minus 1 equals 1
Example three, 2oo3 colon HFT equals 3 minus 2 equals 1
Calculating PFDavg for SIL Verification
PFDavg stands for average probability of failure on demand. In low demand operation it answers one question, if the process asks the safety instrumented function to act right now, what is the chance it fails to respond.
Each subsystem, sensor, logic solver and final element, gets its own PFDavg figure from its dangerous undetected failure rate and its proof test interval, then the three figures are added together for the complete loop.
| SIL Level | PFDavg Range, Low Demand | Risk Reduction Factor |
|---|---|---|
| SIL 1 | 0.1 to 0.01 | 10 to 100 |
| SIL 2 | 0.01 to 0.001 | 100 to 1000 |
| SIL 3 | 0.001 to 0.0001 | 1000 to 10000 |
| SIL 4 | 0.0001 to 0.00001 | 10000 to 100000 |
A Practical Example From the Field
A Yokogawa EJA style pressure transmitter used as a sensor is a Type B device with a safe failure fraction close to 92 percent.
Installed alone in a 1oo1 configuration, hardware fault tolerance is zero and the constraint table caps it at SIL 2. Installed in pairs as a 1oo2 configuration, hardware fault tolerance becomes one, and the same transmitter family can support a SIL 3 claim instead.
Why Equipment Certification Alone Is Not Enough
A device carrying a SIL 3 capable certificate tells an engineer it is, on its own, built well enough for a SIL 3 loop.
It does not confirm the finished loop, sensor plus logic solver plus final element plus proof test practice, will actually reach SIL 3. Only a full calculation across every component together can confirm that.
The individual device was designed and manufactured following the required systematic capability requirements for the SIL level named on its safety manual.
Whether this specific combination of devices, at this proof test interval, with this voting architecture, meets the target once every number is added together.
Improvement Options When SIL Verification Fails
When a calculated PFDavg misses the target, or the constraint table blocks the claim, an engineer has a limited set of practical levers to pull rather than starting over.
Where the Failure Rate Numbers Come From
This calculation is only as trustworthy as the failure rate data behind it. Engineers pull dangerous failure rates from recognized databases such as OREDA, or from a manufacturer's exida or TUV certified safety manual, rather than marketing literature.
When a manufacturer's figure looks optimistic against an independent database, the more conservative number is used, since a generous input can hide a real weakness in the finished loop.
Mean time to repair and the proof test interval the plant actually intends to follow also come from the safety requirement specification, since both feed directly into the PFDavg formula.
Watch: SIL Verification Explained
SIL Verification Questions Engineers Ask
Related Articles on This Site
- What Is SIL, Safety Integrity Level
- Safety Instrumented Function, SIF Design
- Voting Architectures in Safety Systems
- Safe Failure Fraction Explained in Functional Safety
- Layer of Protection Analysis, LOPA SIL Assessment
External References
- exida: The Fundamentals of SIL Verification, Beyond PFDavg and PFH
- eFunctionalSafety: SIL Verification, PFD or PFH, How to Decide
What We Learn Today
- SIL Verification is a calculation stage, run before installation, that proves a safety instrumented function meets its assigned SIL target using real PFDavg numbers.
- Hardware fault tolerance, safe failure fraction, and voting architecture together decide the maximum SIL a design is allowed to claim.
- A manufacturer's SIL certificate confirms one device, not a finished loop, so every device in the chain still needs to be verified together.