
SIL determination is the engineering process of deciding what Safety Integrity Level (SIL) a Safety Instrumented Function (SIF) must achieve to reduce risk to a tolerable level.
IEC 61511-3 recognises three main methods: the Risk Graph, Layer of Protection Analysis (LOPA), and the Consequence Severity Matrix (also called the Safety Layer Matrix or Hazard Event Severity Matrix).
This guide explains how how each SIL determination method works, when to use it, and how they compare — and how to choose between them for your next SIL determination study.
IEC 61511-3 does not mandate a specific SIL determination method. It requires that the method be applied consistently, calibrated to the company's tolerable risk criteria, and documented in the Safety Requirements Specification.
The choice of method is a deliberate engineering decision not a field-by-field default.
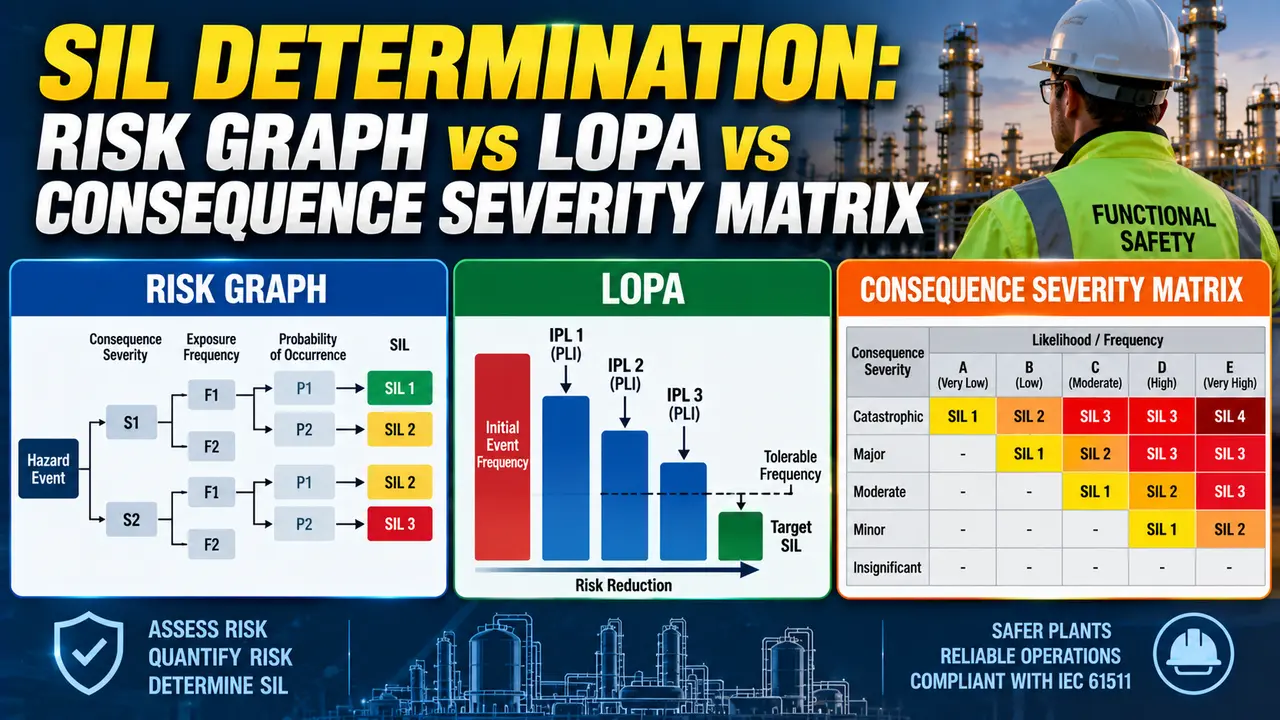
Why SIL Determination Method Selection Matters for IEC 61511
A plant HAZOP study will typically identify dozens or hundreds of hazardous scenarios. Each scenario requiring a SIF needs a SIL target. The method used to establish that target must be documented.
The SIL determination method determines how conservative that target will be. A Risk Graph applied to a scenario might produce SIL 2. LOPA on the same scenario might produce SIL 1.
LOPA accounts for the probability of personnel being in the hazard zone and the probability of ignition, while a standard Risk Graph does not explicitly model these conditional modifiers.
Many companies have used the IEC example Risk Graph without calibration for years, resulting in SIL assignments that are either over-conservative (demanding SIL 2 where SIL 1 would suffice) or unconservative (assigning SIL 1 where the tolerable risk level actually requires SIL 2). An IEC 61511 Functional Safety Assessment (FSA) will examine whether the Risk Graph used is calibrated and documented.
LOPA does not have this same calibration problem because LOPA's link to a tolerable risk criterion is explicit and numerical — the tolerable risk target is a direct input to every LOPA calculation.
Method 1: The Risk Graph as a SIL Determination Tool
How the Risk Graph Works
The Risk Graph is a branching decision tree with four parameters: consequence (C), exposure frequency (F), probability of avoiding the hazard (P), and demand rate without the SIF (W).
Each parameter gets a qualitative level (C1 to C4, F1/F2, P1/P2, W1 to W3). Following the branches gives a SIL target or no SIS required.
C (Consequence): Severity of the consequence if the hazardous event reaches people or assets. C1 = minor injury, C2 = serious and irreversible injury, C3 = one fatality, C4 = several fatalities.
F (Frequency/Occupancy): How often people are in the hazard zone. F1 = rare to occasional occupancy, F2 = frequent to permanent occupancy.
P (Probability of Avoiding): The chance the hazardous event can be perceived and avoided once equipment fails. P1 = possible in some circumstances (slow-developing condition), P2 = almost impossible (instantaneous explosion).
W (Demand Rate): The frequency of the unwanted event without SIS protection. W1 = very low, W2 = low, W3 = relatively high. Existing non-SIS safeguards are credited in the W parameter.
Calibration means assigning quantitative boundaries to each qualitative level (C1 to C4, W1 to W3, etc.) that are consistent with the company's tolerable risk target. Without calibration, two engineers will assign different C and W levels to the same scenario and get different SIL outputs from the same graph.
Calibration is documented in a Tolerable Risk Criteria document or equivalent before the study. The ISA-84 standard and IEC 61511-3 Annex B both provide guidance on calibration methodology. If your company uses a Risk Graph that was drawn by a previous engineer and has never been formally calibrated, treat all SIL assignments made with that graph as unverified until the calibration is confirmed.
Risk Graph Worked Example: Reactor Overpressure
Suppose a reactor has a runaway reaction scenario with these Risk Graph parameters:
F: F2 (frequent occupancy — operator rounds every hour)
P: P2 (avoidance almost impossible — instantaneous overpressure rupture)
W: W1 (low demand rate — initiating event is loss of cooling, estimated 0.1/yr,
with a PRV and a BPCS loop already in place as non-SIS safeguards)
Risk Graph output (IEC 61511-3 example graph):
Starting at C3, following F2, P2, W1 branches: SIL 1
If W were W2 (no existing non-SIS safeguards), the output would be SIL 2.
The W parameter is where existing non-SIS safeguards are credited in the Risk Graph.
Method 2: LOPA as a SIL Determination Method
How LOPA Determines SIL
LOPA starts with an initiating event frequency, credits each IPL with its Probability of Failure on Demand (PFD), applies conditional modifiers, and computes the mitigated consequence frequency.
If the mitigated frequency exceeds the tolerable risk target, the ratio gives the required SIF PFD — which maps directly to a SIL. The full LOPA procedure is in the LOPA guide.
For the same reactor scenario: IEF = 0.1/yr, IPL1 PFD 0.1, IPL2 PFD 0.01, conditional modifier 0.25. Mitigated frequency = 0.1 × 0.1 × 0.01 × 0.25 = 2.5×10⁻⁵/yr.
Against a tolerable risk target of 1×10⁻⁴/yr, this is already tolerable — no SIF required. The Risk Graph gave SIL 1; LOPA gives no SIF, because LOPA explicitly credits the conditional modifier.
This conservatism is intentional. The Risk Graph trades precision for speed. Each parameter branch in the graph represents an order-of-magnitude step, so the result is inherently rounded to the nearest SIL. LOPA, by contrast, can produce a result that is clearly below the SIL 1 threshold, making no SIF the correct answer for that scenario.
The implication is that a plant using a Risk Graph for SIL determination will typically identify more SIL-rated SIFs than the same plant studied using LOPA. For a large plant, the difference in SIS engineering cost between these two sets of SIL assignments can be significant. This is a legitimate reason to use LOPA rather than a Risk Graph — not to lower safety, but to avoid unnecessary SIL requirements that cost money without reducing real risk.
Method 3: Consequence Severity Matrix for SIL Determination
How the Consequence Severity Matrix Works
The Consequence Severity Matrix (Safety Layer Matrix in ISA-84) is the simplest method. It plots consequence severity against the number of existing IPLs to produce a SIL output from the intersection cell.
The key assumption is that each IPL reduces risk by one order of magnitude. With several severity rows and IPL count columns, the matrix produces a SIL recommendation without any numerical inputs.
This makes the matrix extremely fast to apply — a HAZOP team can walk through the full SIF list in a day.
But it is the least rigorous method.
A BPCS alarm and a SIL 2 SIF both count as one IPL credit in the matrix, even though their risk reduction differs by two orders of magnitude.
The matrix is best used early in a study to quickly separate scenarios that clearly need a SIF (high consequence, few existing IPLs) from those that clearly do not (low consequence, many existing IPLs). This screening flags the high-priority scenarios for a more rigorous LOPA or calibrated Risk Graph analysis.
Do not use the matrix alone as the basis for a SIL 2 or SIL 3 assignment. At these levels, the engineering investment in the SIS is large, and the one-IPL-per-order-of-magnitude assumption may under- or over-credit the actual safeguards significantly. The matrix is a triage tool, not a design basis.
Risk Graph vs LOPA vs Consequence Severity Matrix: Full Comparison
| Criteria | Risk Graph | LOPA | Consequence Severity Matrix |
|---|---|---|---|
| IEC 61511-3 location | Annex B | Annex F | Annex D (as Safety Layer Matrix) |
| Method type | Qualitative to semi-quantitative, branching decision tree | Semi-quantitative, order-of-magnitude arithmetic | Qualitative, look-up table |
| Inputs required | C, F, P, W — all qualitative, calibrated to company risk criteria | Initiating event frequency (numerical), IPL PFDs (numerical), conditional modifiers, tolerable risk target | Consequence severity category, count of existing IPLs — all qualitative |
| Output | SIL 1 to 3 or no SIS required | Required SIF PFD → SIL 1 to 3, or risk already tolerable | SIL 1 to 3 or no SIS required |
| Typical study time per scenario | 5 to 15 minutes per scenario with an experienced team | 30 to 60 minutes per scenario — data gathering is the main effort | 2 to 5 minutes per scenario — fastest of the three |
| Consistency between analysts | Moderate. Different engineers can assign different C and W levels to the same scenario without documented calibration guidance. | High. Initiating event frequencies and IPL PFD values are taken from generic data tables; disagreements are easier to trace and resolve. | Low. Consequence severity category assignment is highly subjective without explicit calibration criteria. |
| Conservatism | Typically more conservative than LOPA by 0 to 1 SIL level, due to order-of-magnitude rounding and absence of conditional modifiers. | Least conservative of the three. Explicitly credits conditional modifiers (probability of ignition, personnel occupancy) that Risk Graph absorbs into W approximately. | Most conservative. The one-IPL-per-order-of-magnitude assumption does not distinguish between high-quality IPLs (SIL 2 SIS, PRV) and low-quality IPLs (operator alarm response). |
| Calibration requirement | High. The Risk Graph must be calibrated to the company's tolerable risk target before use. The IEC example graph is not ready to use as-is. | Low. The link to the tolerable risk target is an explicit numerical input, not embedded in graph calibration. | High. The consequence severity categories and the IPL credit assumption must both be calibrated for the matrix to be defensible. |
| Best used for | Mid-sized studies where the team has a calibrated Risk Graph and most scenarios are clearly SIL 0, 1, or 2. Not ideal for scenarios at the SIL boundary. | Any scenario requiring SIL 2 or above, or where the Risk Graph result is uncertain and a more rigorous answer is needed. Standard method for offshore, nuclear, and pharmaceutical industries. | Screening only. First-pass triage during a HAZOP to identify which scenarios need further analysis by Risk Graph or LOPA. |
| Standard reference | IEC 61511-3 Annex B, ISA-84 Annex D | IEC 61511-3 Annex F, CCPS LOPA book (2001) | IEC 61511-3 Annex D, IEC 61508-5 Annex G |
SIL Determination Method Selector
Watch: SIL Determination and LOPA Explained for Engineers (2024)
SIL Determination Questions Engineers Ask
Related Articles on This Site
- SIL Verification vs SIL Validation: What Is the Difference?
- Safe Failure Fraction Explained in Functional Safety
- Safety Instrumented Function (SIF) Design Explained
- What Is a Functional Safety Assessment?
- HAZOP Study Explained: 7 Guide Words You Need to Know
External References
- ISA-84 / IEC 61511: Safety Instrumented Systems for the Process Industry Sector | ISA
- LOPA vs Risk Graph vs Risk Matrix: When to Use Each Method | ifluids (2026)
What We Learn Today
- IEC 61511-3 accepts three SIL determination methods: the Risk Graph (Annex B), the Consequence Severity Matrix (Annex D), and LOPA (Annex F). All three are legitimate, but they must be applied consistently, calibrated to the company's tolerable risk criteria, and documented. The uncalibrated IEC example Risk Graph is not ready to use as-is — it requires calibration before a SIL determination made from it is defensible.
- The Risk Graph is faster than LOPA but more conservative by 0 to 1 SIL level, because it does not explicitly credit conditional modifiers such as probability of ignition or probability of personnel in the hazard zone. LOPA is the preferred method for SIL 2 and above, for scenarios at the SIL boundary, and for any audit or verification where full traceability to a tolerable risk target is required.
- The Consequence Severity Matrix (Safety Layer Matrix) is a qualitative screening tool — not a final SIL assignment method. Use it during HAZOP to quickly triage which scenarios need further SIL analysis. Then apply a calibrated Risk Graph or LOPA for the detailed SIL determination that goes into the Safety Requirements Specification.