
A typical plant runs hundreds of PID loops, and many quietly sit in manual, oscillate or fight sticky valves. Automated loop assessment finds those weak loops from historian data long before operators start to complain.
Most control loops are tuned once at commissioning and then forgotten while valves wear and process conditions drift. A monitoring tool scores every loop daily so engineers fix the few that matter most.
What Is CLPM in Process Control?
Control loop performance monitoring, or CLPM, is the automatic, continuous assessment of PID loops using process data to find loops that are in manual, oscillating, saturated or poorly tuned. It builds on the tuning basics in PID controller tuning guide.
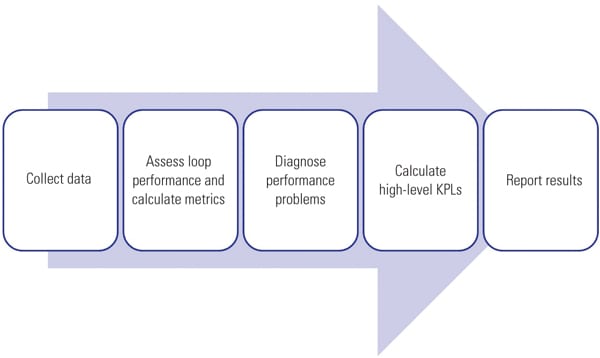
POWER Magazine describes the basic CLPM cycle as collecting data, calculating metrics, ranking loops and then diagnosing and fixing the worst ones. The cycle then repeats so gains are kept over time.
The data usually comes from the plant historian, see what is a process historian. Setpoint, process value, output and mode are the four signals needed for each loop.
How a CLPM Tool Works
Sampling must be fast enough to see oscillations, so check the scan and storage settings described in DCS historian data storage. Heavily compressed data can hide real problems.
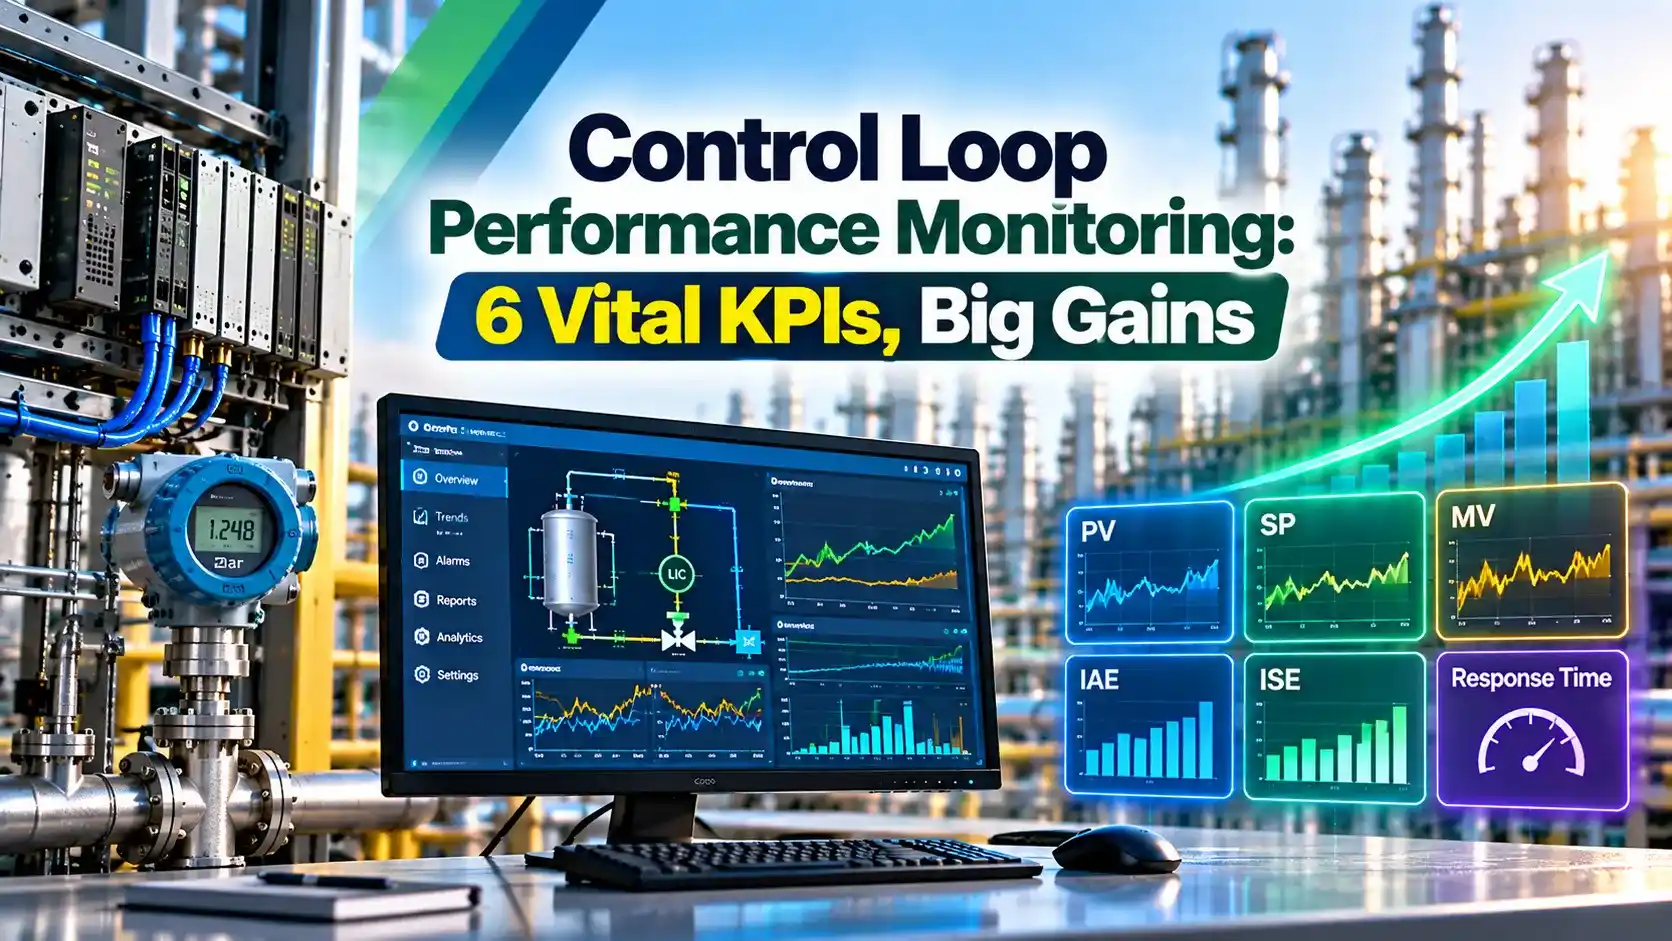
6 Vital Loop KPIs
| KPI | What It Shows | Warning Sign |
|---|---|---|
| Service factor | Time in normal mode | Below about 90 percent |
| Valve travel and reversals | Actuator wear | Constant small reversals |
| Oscillation index | Cyclic behaviour | Regular period cycles |
| Variability | Standard deviation of error | Rising over weeks |
| Harris index | Variance against minimum possible | Far above the benchmark |
| Saturation | Output stuck at a limit | Long time at 0 or 100 percent |
A low service factor often points to a loop operators do not trust. High reversals with small movements can indicate stiction or a worn valve, related to issues in control valve passing causes.
The Harris index compares actual variance with the minimum variance possible for the process dead time. It needs a dead time estimate, so treat it as a guide rather than an absolute score.
No single KPI tells the whole story, so good tools combine several scores into one ranking. A loop that oscillates, reverses often and spends time in manual is a strong candidate for a field visit and a careful retune.
Benefits Reported by Industry
Control Engineering reports that CLPM programs can raise output by about 2 to 5 percent and cut energy use by about 5 to 15 percent. Results depend on how poor the loops were at the start.
In one Control Engineering example, a ceramic proppant mill saved about 100000 USD per year in energy by correcting fewer than 6 percent of its PID loops. Focusing on the worst few loops gives most of the benefit.
Smuts and colleagues described a similar approach in a power plant at ISA POWID 2011. They used daily loop reports to find oscillations and valve problems across units.
Service Factor and Variability Formula
Setpoint shift toward limit ≈ 2 × (Old standard deviation minus New standard deviation)
Example, one day:
1296 minutes in auto out of 1440 minutes
Service factor = 1296 ÷ 1440 × 100 = 90.0 percent
Standard deviation reduced from 2.0 to 1.0 units
Setpoint can move about 2 × 1.0 = 2.00 units closer to the limit
The factor of 2 assumes you keep the same two standard deviation margin from the limit. Reducing variability is what makes running closer to the limit safe.
Loop KPI Calculator
Convert the setpoint shift into money using yield or energy per unit. That turns a routine tuning job into a clear business case for managers.
Steps to Start a CLPM Program
Use step tests or relay methods from DCS PID auto tune methods when retuning. Parameter meanings are explained in PID tuning parameters.
- Finds hidden bad loops automatically.
- Prioritises work by impact.
- Tracks valve health over time.
- Measurable energy and output gains.
- Needs good historian data.
- KPIs can flag loops wrongly.
- Fixes still need skilled engineers.
- Licence and setup cost.
CLPM does not replace tuning skill, see how to tune a PID controller. It fits well within broader DCS control strategies and loop types covered in PID controller types.
Power Plant CLPM Paper PDF
Improving Loop Performance Video
Control Loop Performance Monitoring FAQ
Related Articles
- PID Controller Tuning Guide
- How to Tune a PID Controller
- PID Tuning Parameters
- DCS PID Auto Tune Methods
- Control Valve Passing Causes
External References
- Loop Monitoring in a Power Plant, Smuts et al., ISA POWID 2011
- CLPM Improving Process Efficiency and Throughput, Control Engineering
- PID Controller, Wikipedia
What We Learn Today
- Control loop performance monitoring scores every PID loop automatically.
- Service factor, oscillation, variability and Harris index are key KPIs.
- Fixing a small share of bad loops can save energy and raise output.