A calibration sheet full of numbers means nothing until you turn each reading into an error and compare it with the tolerance. Here is the method instrument technicians use every day, with formulas, a worked 5 point example and a calculator.
Every calibration ends with one question: is the instrument inside its tolerance or not. This guide shows the error formulas, a full 5 point up and down example and the pass or fail logic used in the field.
How Do You Calculate Calibration Error?
Calibration error calculation means subtracting the true value from the standard from the reading of the instrument under test, then expressing that difference in units, in percent of span or in percent of reading. The result is compared with the allowed tolerance to decide whether the instrument passes, needs adjustment or must be replaced.
- Error = Instrument reading minus Standard value.
- Percent of span = Error ÷ Span × 100.
- Percent of reading = Error ÷ Ideal reading × 100.
- For a 4 to 20 mA output, divide the mA error by 16 mA.
- Pass if the largest absolute error is inside the tolerance.
The sign matters. In Lessons in Industrial Instrumentation on Control.com, Tony Kuphaldt uses the convention that error equals the instrument reading minus the standard, so a reading below the standard gives a negative error, as covered in instrument accuracy and error.
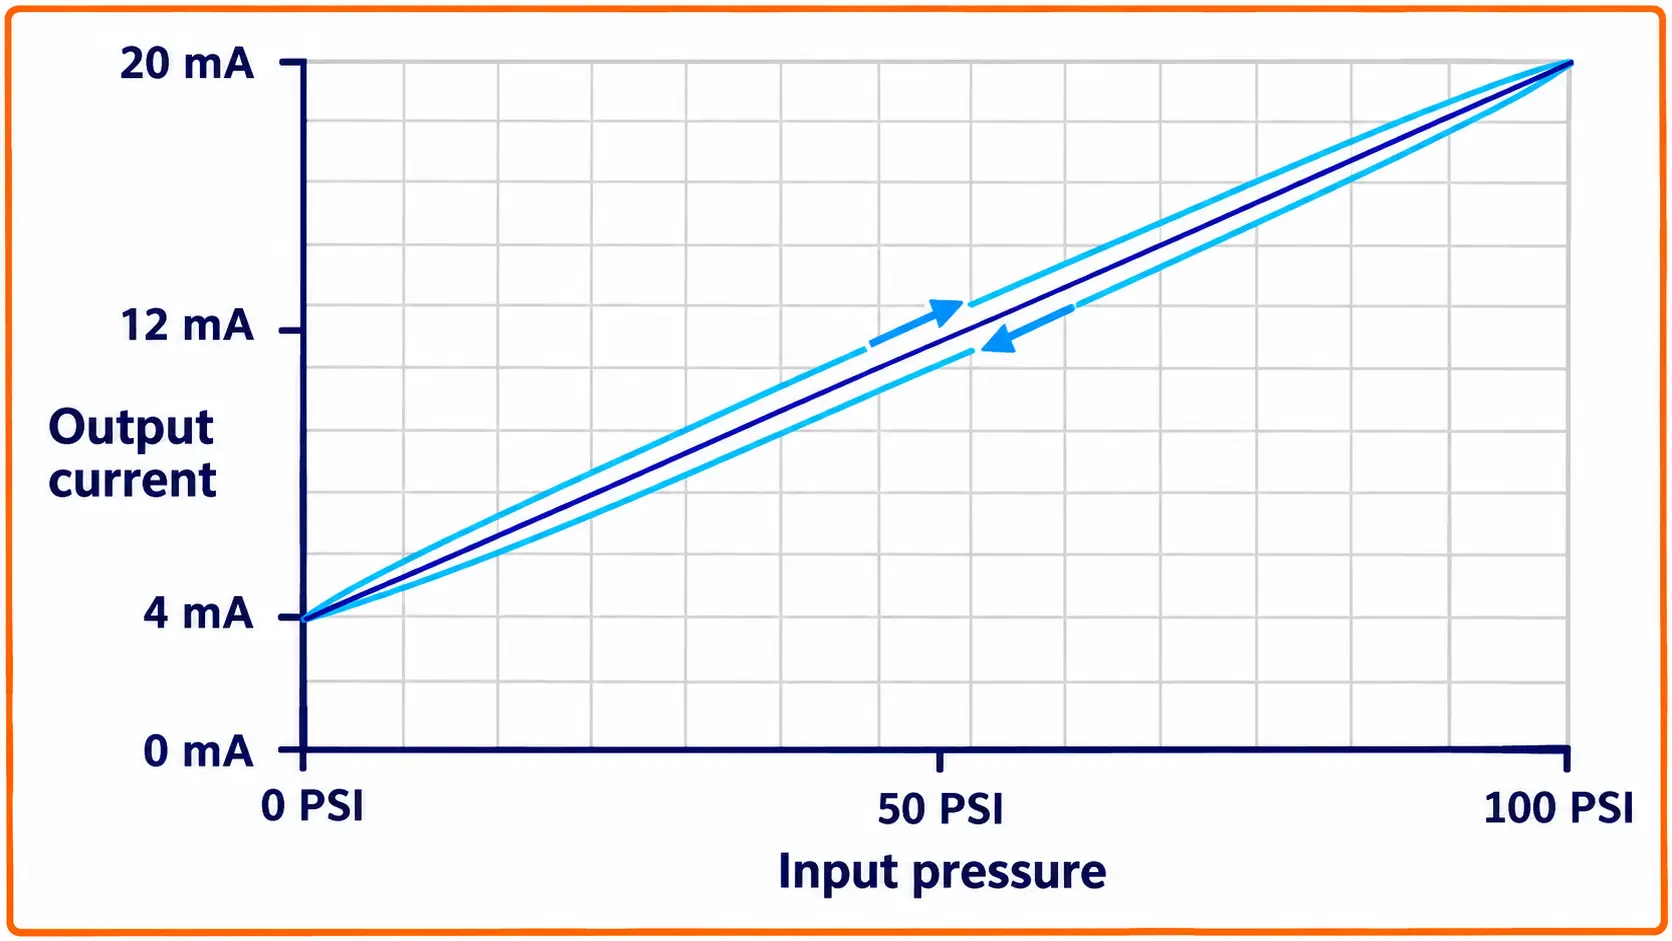
The graph shows why a single upscale run is not enough. A transmitter with hysteresis reads low on a rising input and high on a falling one, so only an up and down test reveals the full error, just as in a 5 point DP transmitter calibration.
Calibration Error Calculation Formula: Units, Span and Reading
In any calibration error calculation there are three common ways to express the same error, and the datasheet tells you which one applies. Mixing them up is the most common reason a good transmitter is wrongly failed, or a bad one wrongly passed.
Error % span = Error ÷ Span × 100
Error % reading = Error ÷ Ideal value × 100
Span = URV minus LRV
For 4 to 20 mA output, span = 16 mA
| Method | Divide Error By | Typical Use | Note |
|---|---|---|---|
| Error in units | Nothing | Gauges, thermometers, local indicators | Easy to read on site |
| Percent of span | Calibrated span | Transmitters, 4 to 20 mA loops | Same limit at every point |
| Percent of reading | Ideal value at that point | Flow meters, analysers, weighing | Tight at high values, loose near zero |
| Percent of full scale | Upper range limit of the sensor | Gauges and sensor datasheets | Can be much larger than span limit |
Beamex points out in its CMX Calculations document that percent of reading error is not calculated when the ideal value is zero, because dividing by zero has no meaning. This is one reason most process transmitters are specified in percent of span, as discussed in pressure transmitter accuracy specifications.
A 0.1 percent of span limit on a 0 to 10 bar transmitter allows 0.01 bar at every point. A 1 percent of reading limit allows only 0.025 bar at 2.5 bar but 0.1 bar at 10 bar, so the two methods judge the same instrument very differently.
Percent of Span Calibration Error Calculation for 4 to 20 mA
For a 4 to 20 mA loop, first convert the applied input into the ideal current, then subtract it from the measured current. Dividing that mA error by the 16 mA output span gives the error in percent of span directly.
Example: 0 to 10 bar, input 7.5 bar
Ideal = 4 + 16 × 7.5 ÷ 10 = 16.000 mA
Measured = 16.090 mA
Error = 0.090 mA
Error % span = 0.090 ÷ 16 × 100 = 0.56 %
In units: 0.56 % of 10 bar = 0.056 bar
The same error is 0.75 percent of reading at 7.5 bar, because 0.056 divided by 7.5 is 0.0075. Always state which basis you used on the calibration record.
Solved 5 Point Calibration Error Calculation Example
Control.com describes the standard up and down test at 0, 25, 50, 75 and 100 percent going up, then 75, 50, 25 and 0 percent coming down. Each point must be approached from the same direction, so if you overshoot a test point, back off and approach it again.
Take a 0 to 10 bar pressure transmitter with a 4 to 20 mA output and a tolerance of plus or minus 0.5 percent of span. The as found readings, taken before any adjustment, are shown below with each error in percent of span.
| Input, bar | Ideal mA | Up mA | Up Error % | Down mA | Down Error % |
|---|---|---|---|---|---|
| 0 | 4.000 | 4.020 | 0.13 | 4.030 | 0.19 |
| 2.5 | 8.000 | 8.030 | 0.19 | 8.050 | 0.31 |
| 5.0 | 12.000 | 12.050 | 0.31 | 12.080 | 0.50 |
| 7.5 | 16.000 | 16.060 | 0.38 | 16.090 | 0.56 |
| 10.0 | 20.000 | 20.080 | 0.50 | 20.080 | 0.50 |
The largest absolute error is 0.56 percent of span at 7.5 bar going down, which is outside the 0.5 percent tolerance, so the as found result is a fail. The errors also grow from zero to full scale, which points to a span shift plus a small zero shift.
After a zero and span trim, as covered in zero and span adjustments, the technician repeats the full run. The as left errors all fall within plus or minus 0.06 percent of span, so the instrument is returned to service with both records kept.
At 7.5 bar: 16.090 minus 16.060 = 0.030 mA
Hysteresis = 0.030 ÷ 16 × 100 = 0.19 %
Max error (as found) = 0.56 % span
0.56 % is above 0.5 %, so FAIL
Record the as found readings before you touch the zero or span adjustment, even when the instrument is obviously out. Without them, nobody can estimate drift or decide whether past product made with this loop needs review.
Calibration Error Calculation Calculator
The calculator repeats the 7.5 bar down point from the solved example, so you can check each row of your own calibration error calculation the same way. Enter the as left readings afterwards to confirm the instrument now passes.
Pass or Fail: Tolerance, Rounding and Maximum Error
Beamex defines the found maximum error as the highest absolute value of all the errors calculated at the test points. That single number, from both the up and the down runs, is what the calibration error calculation compares with the tolerance.
Beamex also rounds the error to the resolution of the limit before the comparison, so an error of 0.05493 rounds to 0.05 and passes a 0.05 limit. Abnormal points such as over load or unstable readings are always treated as failed in CMX.
Your reference standard must be clearly better than the tolerance you are checking. A common rule is a test uncertainty ratio of at least 4 to 1, and the details are covered in measurement uncertainty in calibration.
Hysteresis Error and Other Error Types
Control.com describes four classic error shapes, and each one tells the technician what to adjust. Recognising them in the calibration error calculation sheet saves a lot of trial and error, as shown in zero, offset and span errors.
The whole curve moves up or down, so every point has about the same error.
The slope changes, so the error grows toward the top of the range.
The response bends away from a straight line between the end points.
Up and down readings differ at the same input because of friction or loose parts.
Control.com gives a hysteresis example for a 0 to 200 PSI transmitter: at 25 percent it read 7.98 mA going up and 8.03 mA coming down. That is minus 0.125 percent and plus 0.188 percent of span, a total difference of 0.313 percent.
Hysteresis usually comes from mechanical friction, loose couplings or cracked flexures, so adjustments rarely fix it. On smart transmitters it is small, but it still matters on gauges, switches and sensors with poor linearity.
Kuphaldt notes that a single point check, such as blocking and equalising a DP transmitter at zero differential, is a useful quick health test. A pass suggests the whole range is probably fine, while a fail means a full recalibration is needed.
Step by Step Calibration Error Calculation Procedure
A documenting process calibrator can do the arithmetic and store the results, but you should still be able to check any row by hand. Auditors under ISO 17025 often ask exactly that.
- Correct pass or fail decisions on every instrument.
- As found data shows drift and supports interval decisions.
- Error pattern points to the right adjustment.
- Clean records satisfy ISO and customer audits.
- Dividing by the reading when the spec is in span.
- Ignoring the sign of the error.
- Skipping the downscale run and missing hysteresis.
- Adjusting before recording as found values.
Calibration Error Calculation Myths
Write the tolerance basis in the header of every calibration sheet, for example plus or minus 0.5 percent of span. It stops the next technician from redoing the calibration error calculation in percent of reading and reaching a different verdict.
Use the as found history to adjust your calibration interval: instruments that keep passing comfortably can wait longer, while repeated fails call for shorter intervals or a better instrument.
Beamex CMX Calculations PDF
Video on Pressure Transmitter Calibration
Calibration Error Calculation FAQ
For a calibration error calculation, subtract the value of the reference standard from the reading of the instrument under test to get the error in units. Then divide by the span or by the ideal reading and multiply by 100 for a percentage.
Repeat this at every test point, both upscale and downscale. The largest absolute value is the one you compare with the tolerance.
Percent of span error equals the measured value minus the ideal value, divided by the span, times 100. For a 4 to 20 mA output the span is 16 mA, so divide the current error by 16.
For example, 16.09 mA against an ideal 16.00 mA gives a difference of 0.09 milliamps. Dividing by 16 and multiplying by 100 gives 0.56 percent of span.
Percent of span divides the error by the calibrated range, so the allowed error is the same at every point. Percent of reading divides by the value at that point, so the allowed error shrinks toward zero.
Transmitters are usually specified in percent of span. Flow meters and analysers are often given in percent of reading instead.
As found is the condition of the instrument before any adjustment, recorded exactly as it was received. As left is the condition after adjustment, when the instrument goes back to service.
Keeping both records lets you calculate drift over time. It also shows whether an out of tolerance instrument may have affected earlier process results.
Compare the downscale reading with the upscale reading at the same input point. Convert that difference into percent of span using the same formula as for normal errors.
The largest difference across all points is the maximum hysteresis. Mechanical friction, worn links or loose parts usually cause it, so a simple zero or span adjustment rarely removes it from the instrument.
The acceptable error is the tolerance written in your plant procedure, which is usually based on the process need and the instrument datasheet. Smart pressure transmitters are often checked against a few tenths of a percent of span.
Local gauges and switches normally have wider limits. Always state the basis, span or reading, next to the number.
A 4 to 20 mA signal has its zero at 4 milliamps and its full scale at 20 milliamps. The usable span is therefore 20 minus 4, which is 16 milliamps.
Dividing a current error by 16 converts it straight into percent of span. Dividing by 20 would understate the error and could pass a faulty transmitter.
Related Articles
- Instrument Accuracy and Error
- Offset Error, Zero Point Error and Span Error
- Measurement Uncertainty in Calibration
- Instrument Calibration Common Terms
- Level Transmitter 5 Point Calibration
External References
- CMX Calculations, Beamex
- Calibration Errors and Testing, Lessons in Industrial Instrumentation, Control.com
- Calibration, Wikipedia
What We Learn Today
- Calibration error calculation starts with the reading minus the standard, then converts that error to percent of span or percent of reading as the datasheet requires.
- A 5 point up and down test at 0, 25, 50, 75 and 100 percent reveals zero, span, linearity and hysteresis errors in one run.
- The largest absolute error, rounded to the limit resolution, decides pass or fail, and both as found and as left records must be kept.