
Instrumentation Basics · Calibration · Accuracy · Error Analysis
Instrument Accuracy and Error: 4 Overlooked Facts Every Engineer Must Know
Two transmitters can carry the exact same accuracy percentage on their datasheet and still perform very differently in real engineering units. This guide explains instrument accuracy and error in plain terms, with a video walkthrough and a live error calculator.
Why Accuracy Specifications Are More Complicated Than They Look
Accuracy tells you how close a measurement is to the true value, while error is simply the difference between them. That sounds simple enough, but the way accuracy is expressed on a datasheet, as a percent of full span or a percent of actual reading, changes the real world error in engineering units dramatically, especially at low range.
Understanding instrument accuracy and error properly also means keeping it separate from precision, since a highly precise instrument can still be inaccurate if it consistently reads the wrong value. This distinction matters just as much for a dew point sensor as it does for a flow or pressure transmitter.
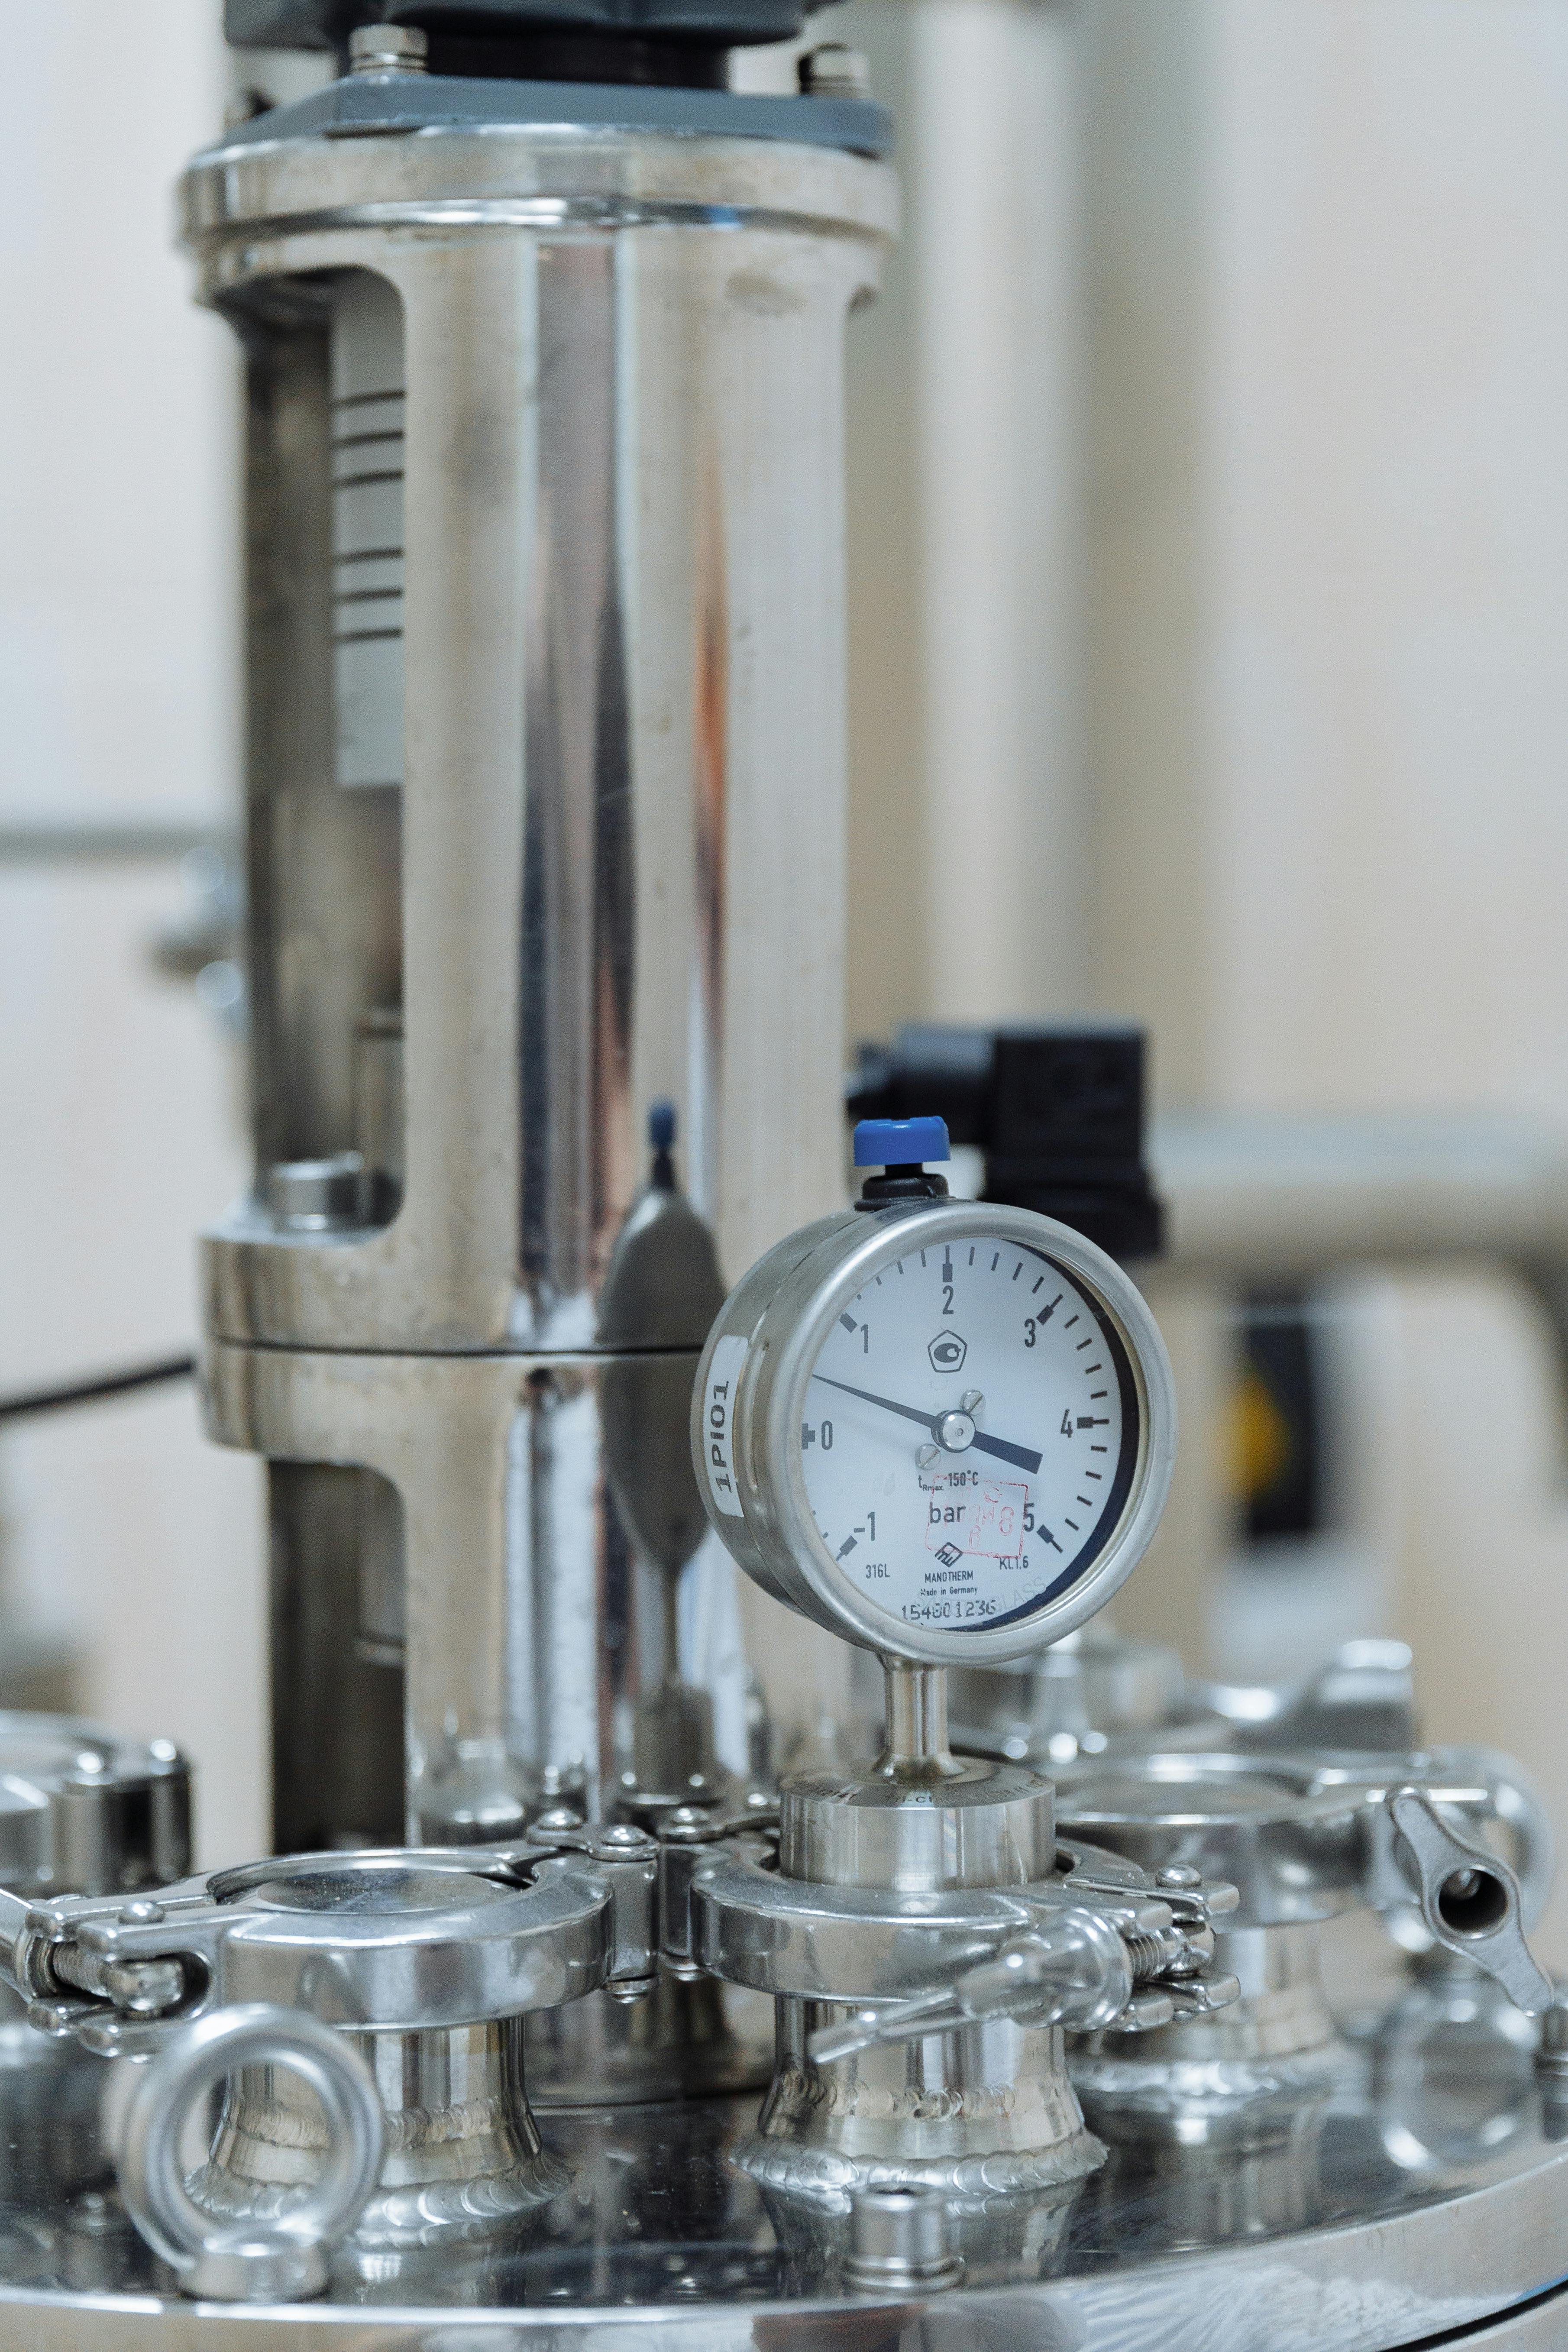
The 4 Overlooked Facts Behind Instrument Accuracy and Error
The Two Accuracy Specification Types
Almost every discussion of instrument accuracy and error eventually comes back to this one distinction.
Error is calculated as a fixed percentage of the instrument's full calibrated range, regardless of the actual reading.
Effect at low range: the same absolute error applies whether the reading is near zero or near full scale.
Error is calculated as a percentage of the actual measured value at that moment, so it shrinks as the reading gets smaller.
Effect at low range: absolute error is smaller near zero and larger near full scale.
How closely an instrument reproduces the same output when measuring the same input repeatedly under the same conditions.
Related to: precision, not accuracy on its own.
How closely the instrument's output follows a straight line relationship with the actual input across its full range.
Poor linearity: creates errors that vary unpredictably across the measurement range.

In figure A is both accurate and precise: the darts are close to the bull’s – eye and close to each other.
In figure B, the set of results is inaccurate but precise: the darts are far from the bull’s – eye but close to each other.
In figure C, the set of results is both inaccurate and imprecise: the darts are far from the bull’s – eye and far from each other. Notice also that the darts are not evenly distributed around the bull’s – eye, so the set, even considered on average, is inaccurate.
In figure D, the set on average is accurate compared with the third case, but it is imprecise. That is because the darts are distributed evenly around the bull’s – eye but are far from each other.
Watch: How to Calculate Transmitter Accuracy
This video explains reference accuracy and walks through calculating accuracy based on calibration range.
The Accuracy to Error Formulas
Percent of Reading Error = (Accuracy % / 100) × Actual Reading
Example: Pressure transmitter, span 0 to 100 bar, accuracy ±0.1% At 100 bar reading: %FS error = 0.1% x 100 = 0.1 bar (0.1% of reading) At 10 bar reading: %FS error = still 0.1 bar (now 1.0% of reading) Notice the absolute error in bar stays the same for a %FS specification, but as a percentage of the actual reading, it grows ten times larger at 10 bar compared to 100 bar. This is exactly why low range readings on a wide span instrument can be far less accurate in relative terms than the datasheet number implies.
Percent of Span vs Percent of Reading Comparison
| Reading | %FS Error (Absolute) | %FS Error (as % of Reading) |
|---|---|---|
| 100 bar (full scale) | 0.1 bar | 0.1% |
| 50 bar | 0.1 bar | 0.2% |
| 10 bar | 0.1 bar | 1.0% |
| 5 bar | 0.1 bar | 2.0% |
Where Accuracy Specifications Matter Most
Instrument accuracy and error considerations show up across nearly every measurement application in a plant.
Flow measurement is especially sensitive to turndown ratio and low range accuracy.
Wide ranged transmitters can show poor relative accuracy at low process pressures.
Accuracy specs often combine a fixed value with a percent of reading term here.
Linearity across the full weighing range is critical for consistent accuracy.
Tank inventory accuracy depends directly on the transmitter's real world error.
Reference standards must be significantly more accurate than the device under test.
Working With Accuracy Specifications Correctly
- Check whether accuracy is specified as %FS or % of reading: before comparing two instruments on paper.
- Match instrument range to actual operating conditions: avoid an unnecessarily wide turndown ratio.
- Combine independent error sources properly: using root sum square rather than simple addition, when appropriate.
- Recalibrate on a defined schedule: since real world accuracy drifts over time.
- Don't assume %reading accuracy at low flow equals %FS accuracy: they diverge significantly away from full scale.
- Don't confuse accuracy with resolution: a fine display resolution does not guarantee true accuracy.
- Don't ignore the difference between accuracy and repeatability: a consistent reading is not automatically a correct one.
- Don't oversize instrument range beyond the needed turndown: it quietly degrades real accuracy at typical operating conditions.
Instrument Error Calculator
Enter your instrument's accuracy specification, span, and actual reading to calculate the resulting error.
Quick FAQs: Instrument Accuracy and Error
External References
- Wikipedia: Accuracy and Precision
- ISA: Instrument Accuracy Standards and Terminology
- NIST: Guidelines for Measurement Uncertainty
What we learn today
- Instrument accuracy and error depend heavily on whether the spec is percent of span or percent of reading, and the two can give very different results.
- Accuracy and precision are different concepts, an instrument can be consistently wrong or inconsistently right.
- Total error often combines several sources, including linearity, repeatability, and temperature effects, and these should be combined carefully rather than simply added.
- Matching an instrument's range to its real operating conditions, rather than oversizing it, protects real world accuracy at typical readings.