
Utilities such as compressed air, chilled water and steam quietly consume a large share of every plant power bill. Machine learning models trained on historian data can find the best setpoints every hour and prove the savings with measured numbers.
Plants already collect thousands of tags every second, yet most utility setpoints are still fixed by habit. AI energy optimization turns that data into forecasts, better setpoints and verified savings without changing the main process.
What Is AI Energy Optimization?
AI energy optimization is the use of machine learning models on plant data to predict energy demand and recommend or apply setpoints that deliver the same production with less electricity, fuel or steam, working mostly on utilities above the basic control layer. If you are new to the models themselves, start with artificial intelligence and machine learning.
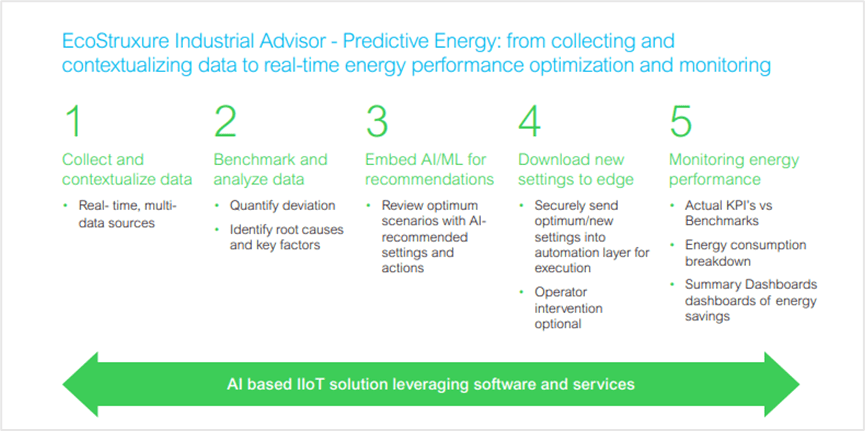
The diagram shows the usual loop: meters and sensors feed a model, the model highlights anomalies and forecasts use, and engineers review recommendations before they reach the control system. The same tags are already stored in most plants, as described in DCS historian data storage.
Why Plants Are Turning to AI for Energy
The International Energy Agency, in its 2025 Energy and AI report, states that widespread adoption of existing AI applications to optimise industrial processes could save energy equivalent to more than the total energy use of Mexico today. It also estimates energy savings of 8 percent by 2035 in light industry, such as electronics and machinery manufacturing.
Schneider Electric reports that its EcoStruxure predictive AI tools can reduce energy consumption by as much as 10 percent, with payback in less than 3 months. One semiconductor customer saved about USD 1 million in energy and 10,000 tons of carbon emissions per plant per year, with the first installation paying back in under 6 months.
DeepMind trained an ensemble of deep neural networks on thousands of Google data centre sensors and cut cooling energy by up to 40 percent. After electrical losses, that gave a 15 percent reduction in overall PUE overhead.
How AI Energy Optimization Works in a Plant
The model layer often combines a load forecast with a plant model, sometimes called a digital twin. The optimiser then searches the setpoints the model allows, much like model predictive control does for process variables.
Write AI setpoints only to supervisory targets with hard high and low clamps in the DCS, never directly to valve or VFD outputs. If the model or network fails, the plant should fall back to the last safe setpoint automatically.
Where the Energy Goes: Main Utility Targets
Compressors, dryers and distribution, often loaded far above real demand.
Chillers, cooling towers and pumps serving process and HVAC loads.
Fuel fired boilers, headers, traps and condensate return.
Motor driven flow systems, often throttled by valves or dampers.
Start with the load that has the largest bill and the best metering. A simple sub meter survey, using the method in electrical energy consumption calculation, usually shows that a few utilities use most of the plant energy.
Compressed Air and AI Energy Optimization
Compressed air is one of the most expensive forms of energy in a factory, since most of the input power becomes heat. AI models learn the real demand pattern and then stage the right mix of single stage and multi stage compressors so that few machines run unloaded.
A widely used rule of thumb from the US Department of Energy is that lowering discharge pressure by about 2 psi saves roughly 1 percent of compressor energy. The model finds the lowest header pressure that still keeps the critical end users above their minimum pressure.
Leak detection is another strong use, because night and weekend flow with no production is mostly leakage. A thermal mass flow meter on the main header gives the flow signal, and the dew point of instrument air must stay protected when dryers are sequenced.
Chiller Plants, Boilers and Pumps
In a chiller plant, the model balances chiller power against pump and cooling tower fan power, since raising one often lowers the other. It adjusts chilled water temperature, condenser water temperature and staging hour by hour, while respecting the process load explained in industrial chiller capacity.
For boilers, AI models predict steam demand and allocate load across boilers in the most efficient way. They also tune excess air against flue gas oxygen and CO limits, which needs reliable analysers and good combustion safeguards.
Pumps and fans benefit when throttling valves are replaced by speed control, as explained in VFD working principle. The model then chooses how many pumps to run and at what speed for the lowest total kW per unit of flow.
In many chiller plants, a pump or tower fan running at reduced speed uses far less power because fan and pump power falls roughly with the cube of speed. That is why AI tools often run more pumps or tower cells at lower speed instead of fewer at full speed.
Methods Used for AI Energy Optimization
| Method | What It Does | Typical Use | Data Needed |
|---|---|---|---|
| Regression baseline | Predicts expected energy from drivers | M and V, EnPI tracking | Months of daily or hourly data |
| ML load forecasting | Predicts demand hours ahead | Compressor and chiller staging | Historian, weather, schedule |
| Anomaly detection | Flags unusual energy use | Leaks, fouling, stuck valves | Normal operating history |
| Setpoint optimisation | Searches best setpoints within limits | Header pressure, chilled water | Model plus constraints |
| Model predictive control | Moves setpoints in closed loop | Large utilities, furnaces | Dynamic models |
| Digital twin | Simulates what if cases | Design and training | Physics plus data |
Anomaly detection, covered in machine learning anomaly detection, often pays back first because it simply points at waste. Where an energy driver cannot be metered directly, a soft sensor can estimate it from other tags.
Annual Saving and Payback Formula
Saving S = E × saving percent ÷ 100
Payback months = project cost ÷ (S × tariff) × 12
Example, compressor house:
P = 250 kW average, h = 8000 hours per year
E = 250 × 8000 = 2000000 kWh per year
S = 2000000 × 8 ÷ 100 = 160000 kWh per year
Money saved = 160000 × Rs 8 = Rs 1280000 per year
Payback = 1000000 ÷ 1280000 × 12 = 9.4 months
Use average measured power, not the motor nameplate, because utilities rarely run at full load. The saving percent should come from a pilot or a conservative vendor estimate, never from the best case brochure figure.
AI Energy Optimization Savings Calculator
Second Worked Example: Verifying a Chiller Saving
A pharma plant builds a baseline model of weekly chiller plant energy from production hours and outdoor wet bulb temperature, using six months of data before the project. For one week after go live, the model predicts 42000 kWh for the actual conditions, while the meters record 38600 kWh.
The verified saving is 42000 minus 38600 = 3400 kWh, which is 3400 ÷ 42000 × 100 = 8.1 percent. Comparing with a modelled baseline, not with last year, removes the effect of weather and production changes from the result.
Freeze the baseline model before go live and agree it with finance and production. Savings that are verified against an agreed baseline are far easier to defend in audits and management reviews.
ISO 50001 and Measurement and Verification
ISO 50001 sets out an energy management system built on plan, do, check and act, with an energy baseline and energy performance indicators, or EnPIs. ISO 50006 gives guidance on baselines and EnPIs, and ISO 50015 covers measurement and verification of energy performance.
AI energy optimization fits neatly into this framework, because regression and machine learning baselines are exactly what EnPIs need. In India, designated consumers under the BEE Perform, Achieve and Trade scheme can also use such data to track specific energy consumption.
6 Smart Steps to Deploy AI Energy Optimization
Hosting is the next decision, since models can run near the plant or in a data centre. The trade offs between latency, security and cost are covered in edge AI versus cloud AI, and integration options appear in AI in PLC, SCADA and DCS.
Data Readiness Checklist
- Main incomer and utility sub meters installed and calibrated.
- Historian storing at least one year of hourly data.
- Flow, pressure and temperature tags for each utility.
- Production plan or output counts available as model drivers.
- Weather data such as ambient and wet bulb temperature.
- Operating modes and shutdowns tagged in the data.
- DCS setpoint limits and fallback logic defined.
- Finds savings that fixed setpoints miss.
- Adapts to weather, load and production changes.
- Supports ISO 50001 EnPIs and M and V.
- Usually needs no change to the main process.
- Depends on clean, well metered data.
- Models drift when equipment or products change.
- Closed loop use needs careful DCS limits.
- Cybersecurity review needed for cloud links.
Industrial Applications for AI Energy Optimization
The same data also helps maintenance, since rising energy per unit often signals fouling or wear before a failure, as in predictive versus preventive maintenance. Upgrading to efficient motors from IEC 60034 efficiency classes then locks in part of the saving permanently.
IEA Energy and AI Report
AI Energy Optimization in Action
AI Energy Optimization FAQ
It is the use of machine learning models on plant data to forecast demand and find setpoints that use less energy. Production and quality limits stay the same while energy use falls.
It usually works on utilities such as compressed air, chillers, boilers, pumps and fans. Recommendations go to operators first and later to the DCS with strict limits.
Schneider Electric reports energy reductions of up to 10 percent with its predictive AI tools. The IEA estimates savings of about 8 percent by 2035 in light industry, such as electronics and machinery.
Real results depend on how wasteful the starting point is and how well recommendations are followed. Always prove savings with a baseline model and measured meter data from your own plant.
Start with the utility that has the largest energy bill and reliable metering. In many Indian plants that is the compressed air system or the chiller plant.
A short sub meter survey over two or three weeks shows where the energy really goes. Pick a system where setpoints can be changed safely without affecting product quality or safety.
No, most tools run on top of the existing DCS, PLC and historian through standard interfaces like OPC UA and Modbus TCP connections. They read tags and write limited supervisory setpoints back.
The control system keeps all interlocks and hard limits in place. If the model or network fails, the plant simply returns to its normal, proven setpoints.
A baseline model predicts what energy use would have been for the actual production and weather. The metered energy is then compared with that prediction for the same period, and the difference is the saving.
ISO 50015 gives guidance on measurement and verification of energy performance in organisations. Agree the baseline with finance and production before the project goes live.
ISO 50001 requires an energy baseline, energy performance indicators and continual improvement. Machine learning models provide accurate baselines that account for changes in production and weather.
The AI tool then becomes part of the check and act stages of the cycle. In daily use it flags drift early and shows whether each action really improved energy performance.
You need calibrated energy meters and at least several months of hourly historian data for each utility. Process tags such as flow, pressure and temperature are also needed.
Operating modes, shutdowns and bad values must be tagged or removed before training. Clean data from a few good meters beats thousands of noisy tags in practice.
Related Articles
- Digital Twin in Industrial Automation
- Model Predictive Control in Process Plants
- Anomaly Detection with Machine Learning
- Edge AI vs Cloud AI in Industrial Automation
- How to Calculate Industrial Chiller Capacity
External References
- Energy and AI, World Energy Outlook Special Report, International Energy Agency
- Industrial AI, Optimizing Energy Efficiency with Predictive AI, Schneider Electric
- ISO 50001, Wikipedia
What We Learn Today
- AI energy optimization uses machine learning on historian and meter data to forecast demand and find setpoints that cut energy without changing production.
- Compressed air, chillers, boilers, pumps and fans offer the biggest savings, and the IEA expects about 8 percent savings in light industry by 2035.
- Savings must be verified against a frozen baseline model, in line with ISO 50001, ISO 50006 and ISO 50015 guidance on EnPIs and M and V.