
Chemical oxygen demand tells you how much organic pollution leaves a plant, and in India it is now reported to regulators in real time. Choosing and maintaining the right online instrument decides whether those numbers are trusted or questioned.
A COD analyzer measures the oxygen needed to oxidise the organic load in wastewater, either by wet chemistry or by optical methods. This guide explains each technology, the CPCB online monitoring rules, sampling, calibration and a simple load calculator.
What Is a COD Analyzer?
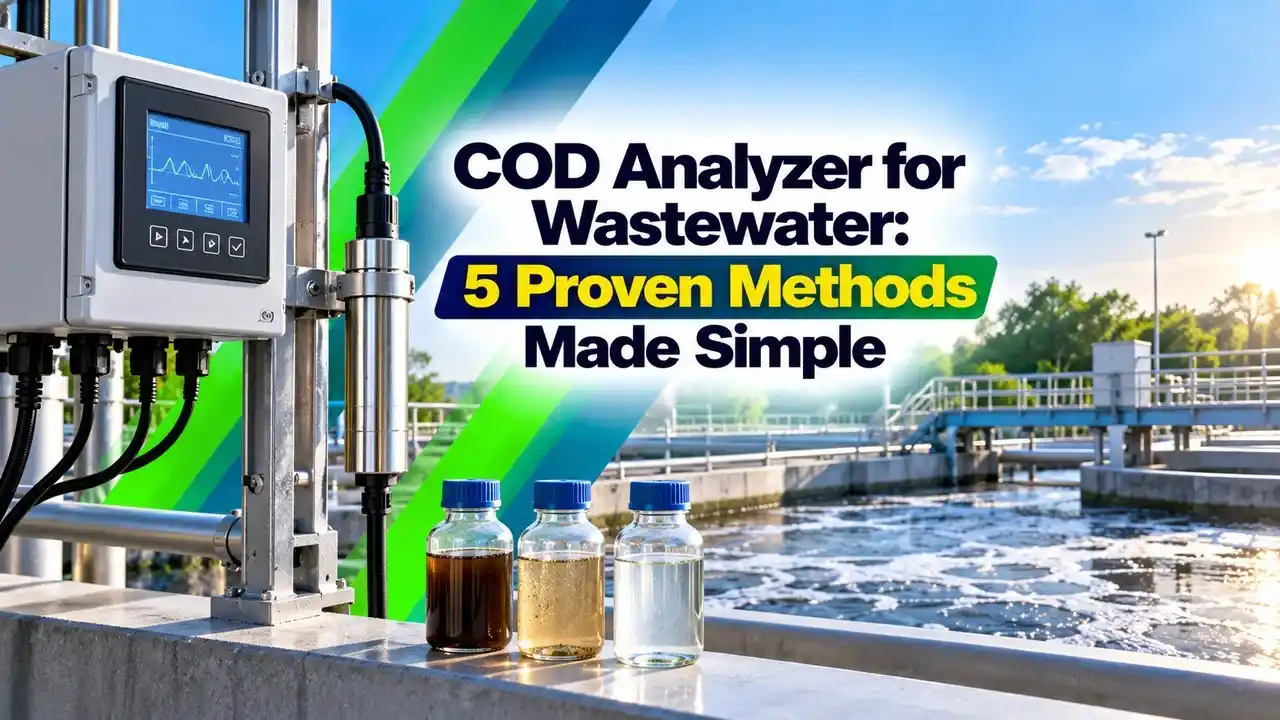
A COD analyzer is an instrument that measures chemical oxygen demand, the amount of oxygen in mg/L needed to chemically oxidise the organic and some inorganic matter in a water sample. It sits with other water quality instruments described in importance of analytical measurements.
Chemical oxygen demand is the main parameter used to judge how polluted an effluent is, because most organic waste consumes oxygen in a river. A high value means the discharge would deplete dissolved oxygen and harm aquatic life downstream.
Laboratory tests give the reference value, but they take hours, so plants use an online instrument for control and compliance. It usually works alongside a TOC analyzer or a BOD estimate, since all three describe organic load in different ways.
In the lab method, a sample is boiled with potassium dichromate and sulphuric acid for about two hours at 150 °C. An online optical sensor can give an equivalent reading every few seconds without any chemicals.
How Chemical Oxygen Demand Is Measured in the Lab
The reference method uses potassium dichromate as a strong oxidant in sulphuric acid, with silver sulphate as a catalyst and mercuric sulphate to mask chloride. After digestion, the remaining dichromate is measured by titration with ferrous ammonium sulphate or by colorimetry.
In India the method is given in IS 3025 Part 58, and APHA 5220 is the usual international reference. Every online COD analyzer is finally judged against these laboratory results, so good lab practice is the foundation of good online data.
5 Proven COD Analyzer Technologies
Automates the lab method with reagent dosing and potentiometric end point.
Measures absorbance of organics at 254 nm against a reference wavelength.
Scans 200 to 750 nm and uses multi wavelength algorithms.
Measures organic carbon and converts it to COD with a site factor.
Oxidises organics on a light activated catalyst and measures charge.
The Central Pollution Control Board guidelines of July 2018 list UV Vis spectrophotometry with entire spectrum scanning as the preferred online approach. The same document notes that automated dichromate analysers with potentiometric titration need about 30 minutes per sample.
TOC based systems use either combustion at 680 °C or UV persulfate oxidation with NDIR detection, as explained in NDIR gas analyzer working principle. The result is converted to COD using a ratio established for that particular effluent.
How an Optical COD Analyzer Works
Many organic compounds, especially aromatic and unsaturated ones, absorb ultraviolet light strongly at 254 nm. An optical probe shines UV light through a fixed path of sample and compares the absorbance with a reference wavelength that organics do not absorb.
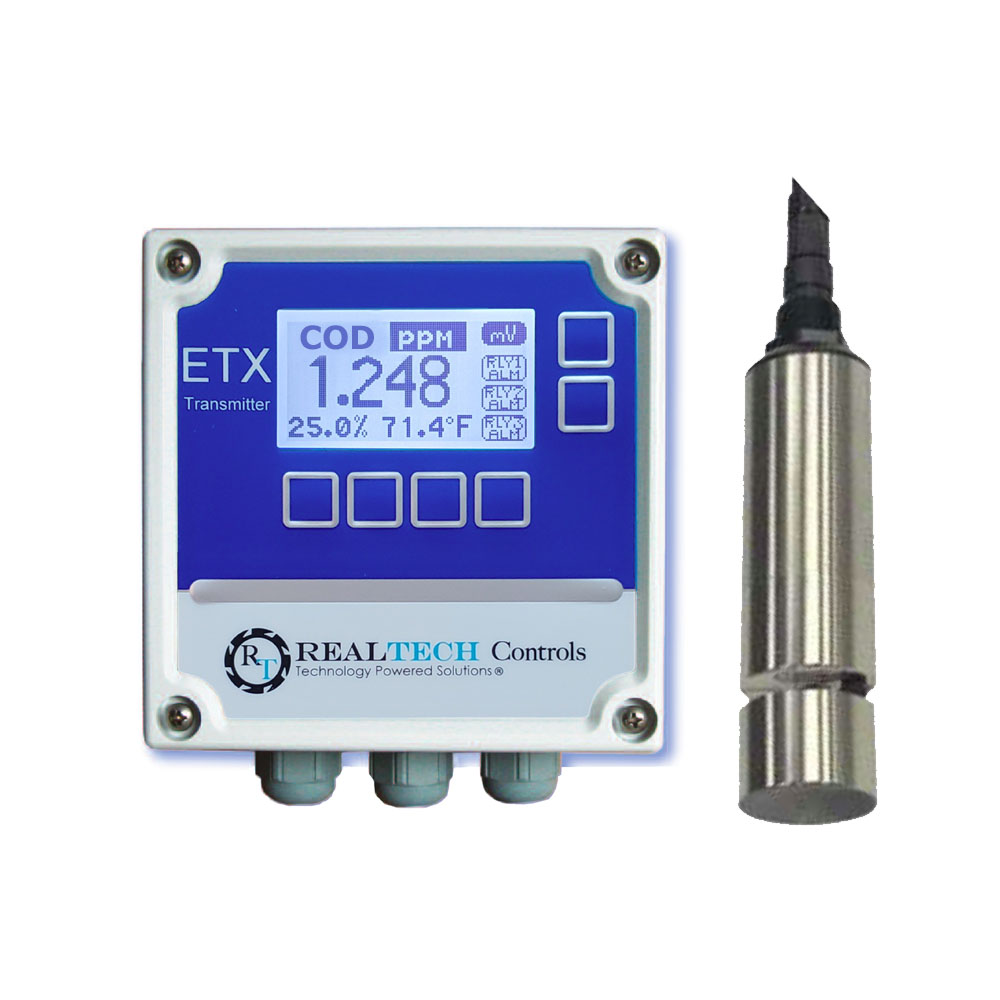
In such a COD analyzer, the reference wavelength corrects for turbidity and lamp ageing. RealTech, for example, states that its UV254 sensor needs no reagents, offers ranges up to 370 mg/L and 1000 mg/L, and uses a wiper to keep the optical windows clean.
Because an optical COD analyzer measures light absorbance and not oxygen demand directly, the reading must be correlated with lab COD for each site. Suspended solids interfere, which is why many plants also measure turbidity at the same point.
Build the UV to COD correlation from at least 10 to 15 paired samples covering low, normal and high load. A two point factor taken on a calm day will fail when the process changes.
CPCB OCEMS Rules for an Online COD Analyzer
The Central Pollution Control Board requires the 17 categories of highly polluting industries, along with common effluent treatment plants, to install online continuous effluent monitoring systems. Distilleries, pulp and paper, textiles, tanneries, pharmaceuticals and refineries are typical examples.
Under the 2018 guidelines, one minute averages must be transmitted to the CPCB and state board servers every 15 minutes. Validation of COD, BOD, TOC and TSS analysers is required once in three months or as specified by the manufacturer, whichever is earlier, using traceable standards such as potassium hydrogen phthalate.
The guidelines also ask for non volatile memory that stores data for at least one year and automatic adaptation to changes in water matrix. The data usually travels over Modbus or a 4 to 20 mA signal to a data logger with a cellular link.
Potassium hydrogen phthalate is the classic COD standard because its theoretical oxygen demand is known exactly. A solution of 425 mg/L KHP has a theoretical COD of 500 mg/L.
BOD to COD Ratio and Pollution Load
The ratio of BOD to COD shows how much of the organic load bacteria can remove, which helps size and tune biological treatment. Values above 0.5 suggest readily biodegradable waste, 0.3 to 0.5 moderate, and below 0.3 poorly biodegradable waste that may need chemical treatment.
Pollution load in kg/day multiplies concentration by flow, so a reliable electromagnetic flow meter is as important as the COD analyzer itself. Regulators and plant managers increasingly track load, not only concentration.
BOD to COD ratio = BOD ÷ COD
Example:
COD = 400 mg/L, BOD = 160 mg/L, flow = 750 m³/day
Load = 400 × 750 ÷ 1000 = 300.0 kg/day
Ratio = 160 ÷ 400 = 0.40, moderately biodegradable
COD Load and Biodegradability Calculator
Second Worked Example: Building a UV Correlation
Suppose lab COD on five paired samples rises from 120 to 360 mg/L while the UV254 absorbance rises from 0.30 to 0.90. The slope is (360 minus 120) ÷ (0.90 minus 0.30) = 400 mg/L per absorbance unit, with zero offset.
A later reading of 0.65 then corresponds to 0.65 × 400 = 260 mg/L, which is above the general discharge limit of 250 mg/L. Recheck the factor every quarter, because a new product or a shift in treatment changes the effluent matrix.
Installing a COD Analyzer Correctly
An online COD analyzer often shares a panel with pH, TSS and conductivity sensors. Keep the sample line short and slope it to drain, so solids do not settle and give a false low reading.
Mark the exact sample point for lab grab samples next to the probe. Many correlation failures come from comparing an online reading with a sample taken somewhere else.
COD Analyzer Maintenance and Troubleshooting
- Clean optical windows or confirm the wiper is working.
- Check reagent levels and expiry on wet chemistry units.
- Run a KHP standard and compare with the expected value.
- Compare online values with lab COD at least monthly.
- Inspect the sample line for blockage and biofilm.
- Verify the data logger time and upload status.
- Record every adjustment in the maintenance log.
A slowly rising reading with no process change usually points to fouled windows, while sudden jumps often come from air bubbles or solids. For wet chemistry units, blocked tubing and old reagents are the usual suspects, as with other analytical instruments.
- Real time view of organic load for process control.
- Early warning of treatment upsets and spills.
- Meets CPCB online reporting requirements.
- Optical units need no hazardous reagents.
- Optical readings depend on a site specific correlation.
- Wet chemistry units use mercury and chromium reagents.
- Solids, foam and fouling distort readings.
- Regular lab comparison is still needed.
Where a COD Analyzer Is Used
In sewage plants, inlet COD helps control aeration together with optical dissolved oxygen sensors, which can save significant blower energy. At the outlet, the same reading proves compliance before discharge.
CPCB Real Time Effluent Monitoring Guidelines
Spectral COD and BOD Monitoring Webinar
COD Analyzer FAQ
It measures chemical oxygen demand, the oxygen needed to chemically oxidise the organic matter in a water sample. The result is reported in milligrams per litre.
Plants use it to track pollution load and to prove compliance with discharge limits. Online units give a reading every few seconds or minutes instead of waiting hours for the lab.
It shines ultraviolet light at 254 nm through a fixed path of sample and measures how much light the organic compounds absorb. A second reference wavelength corrects for turbidity and lamp ageing.
The absorbance is converted to an equivalent value through a correlation built with lab results for that site. No chemicals are needed, so running cost and waste handling stay low.
The 2018 guidelines list UV Vis spectrophotometry with full spectrum scanning as the preferred approach for online monitoring. Automated dichromate titration and TOC correlation are also accepted by the board.
The spectral method adapts better to a changing effluent matrix than a single wavelength probe. Whatever the method, the analyser must be validated against lab results every quarter.
A ratio above 0.5 usually indicates readily biodegradable waste that suits conventional biological treatment. Values from 0.3 to 0.5 show moderate biodegradability and need closer process control.
Below 0.3, the effluent often contains compounds that bacteria cannot easily remove. Such waste may need chemical oxidation or other pretreatment before the biological stage of the plant.
CPCB guidelines ask for validation once in three months or as the manufacturer specifies, whichever comes first. Many plants also run a KHP standard every month as a quick health check.
Compare online values with lab results regularly to catch drift in the correlation. Clean the sensor windows and sample line on a fixed schedule as well.
Common causes are fouled optical windows, a correlation built on too few samples or a grab sample taken at a different point. Air bubbles and settled solids can also distort the readings.
Check the sample point, cleaning system and correlation data first. Then run a standard solution to confirm that the instrument itself is healthy and stable.
It cannot replace the five day BOD test, but it gives a fast estimate of organic load. Many plants use a site ratio to predict BOD from the online reading.
This estimate is useful for daily control decisions on the plant floor. Regulatory BOD values still come from the standard laboratory method in most cases.
Related Articles
- TOC Analyzer Working Principle
- Turbidity Measurement Guide
- What Is pH Sensor and How Does It Work
- How Do Optical Dissolved Oxygen Sensors Work
- Residual Chlorine Analyzer Working
External References
- 1st Revised Guidelines for Real Time Effluent Quality Monitoring System, CPCB
- COD Analyzer and Control System, RealTech
- Chemical Oxygen Demand, Wikipedia
What We Learn Today
- A COD analyzer reports the oxygen needed to oxidise organic matter, using wet dichromate chemistry, UV absorbance, full spectrum scanning or TOC correlation.
- CPCB guidelines prefer full spectrum UV Vis analysers, require quarterly validation and expect one minute averages uploaded to servers every 15 minutes.
- The BOD to COD ratio shows biodegradability, and multiplying concentration by flow gives the daily pollution load in kilograms per day.