Two meters can both say plus or minus 0.5 percent on the datasheet and still differ by a factor of ten at low flow. This guide shows how to read the spec, calculate the real error band and pick the right meter for your turndown.
An accuracy figure means little until you know what it is a percentage of. Here we compare reading based and full scale based specs, work through real numbers and give a calculator for your own meter.
What Is Flow Meter Accuracy?
Flow meter accuracy is how close the indicated flow is to the true flow, stated as a plus or minus band in percent of reading, percent of full scale or percent of span. The basis matters as much as the number, because a full scale spec gives a fixed error in flow units while a reading spec shrinks the error as the flow falls, a point covered in our guide on instrument accuracy and error.
- Percent of reading (Rd) error scales with the actual flow, so it stays the same percentage across the range.
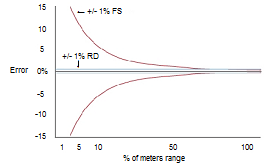
- Percent of full scale (FS) error is a fixed flow value, so it grows as a percentage at low flow.
- 1 percent FS at 10 percent of range equals about 10 percent of reading.
- Repeatability is the scatter of repeated readings, not closeness to the true value.
- Installed flow meter accuracy also includes the transmitter, DCS scaling and installation effects.
Bronkhorst defines full scale accuracy as closeness to the actual value expressed as a percentage of the maximum scale value, and reading accuracy as a percentage of the actual value. Every comparison in this article follows from those two simple definitions, whichever of the types of flow meters you use.
Flow Meter Accuracy: Percent of Reading vs Full Scale
Mass Flow Online explains the full scale case with a 100 ln/min instrument rated 1 percent FS. The error is plus or minus 1 ln/min everywhere, which is about 2 percent of the flow at 50 ln/min and about 10 percent at 10 ln/min.
With a 1 percent of reading spec, the same meter at 10 ln/min is in error by only plus or minus 0.1 ln/min. Mass Flow Online sums it up as better by 10 times at that point.
| Indicated Flow, cc/min | 0.5 % FS Band | 0.5 % of Reading Band |
|---|---|---|
| 1000 | 995 to 1005 | 995 to 1005 |
| 500 | 495 to 505 | 497.5 to 502.5 |
| 250 | 245 to 255 | 248.75 to 251.25 |
| 100 | 95 to 105 | 99.5 to 100.5 |
| 50 | 45 to 55 | 49.75 to 50.25 |
| 10 | 5 to 15 | 9.95 to 10.05 |
The table follows the MAX Machinery technical article for a 1000 cc/min meter with 100:1 turndown. At 10 cc/min the full scale meter may really be passing anything from 5 to 15 cc/min, a 50 percent error, while the reading based meter stays within 9.95 to 10.05 cc/min.
At full scale, both specs give exactly the same error band. The difference only appears once you operate below the top of the range, which is where most plant meters spend their life, so flow meter accuracy at normal flow is what really counts.
Percent of Span and Combined Specifications
Percent of span is the same idea as full scale but uses the calibrated range, such as 20 to 100 m³/h, instead of the sensor maximum. Many DP transmitters quote percent of calibrated span, so re ranging a transmitter changes the error in flow units, as explained in zero and span error.
Some meters use a combined spec with a reading part and a full scale part. Mass Flow Online lists its MAG VIEW meters at plus or minus 0.7 percent of reading and 0.3 percent of range, and you must add both parts to get the error at any flow.
Error in % of reading = Error ÷ Q × 100
Rd spec: Error = Rd % × Q
FS spec: Error = FS % × Qmax
Flow Meter Accuracy Calculation: Solved Example
Take a meter with full scale Qmax = 100 m³/h, specified as plus or minus 0.5 percent of reading plus 0.1 percent of full scale. It is running at 25 m³/h, which is one quarter of its range.
Rd part = 0.005 × 25 = 0.125 m³/h
FS part = 0.001 × 100 = 0.100 m³/h
Total = ±0.225 m³/h
In % of reading = 0.225 ÷ 25 × 100
= ±0.90 % of reading
True flow: 24.775 to 25.225 m³/h
So the datasheet looks like a 0.5 percent meter, but at this flow the real flow meter accuracy is 0.9 percent. At 10 m³/h the same spec gives 0.05 plus 0.1, or 0.15 m³/h, which is 1.5 percent of reading.
Before you compare two quotations, convert both accuracy specs into percent of reading at your minimum, normal and maximum flow. A three row table like this settles most vendor arguments in five minutes.
Flow Meter Error Calculator
Turndown and Its Effect on Flow Meter Accuracy
Turndown is the ratio of maximum to minimum flow over which the meter holds its stated accuracy. A meter with 100:1 turndown and a full scale spec still measures at 1 percent of range, but with a much wider error band, so read the turndown ratio together with the accuracy basis.
DP meters are the classic case, because flow follows the square root of differential pressure. At 10 percent flow the DP is only 1 percent of the range, so a small transmitter error becomes a large flow error, as shown in orifice flowmeter rangeability.
At 10 % flow, ΔP = 0.1² = 1 % of range
Transmitter error 0.1 % of DP span
= 0.1 ÷ 1 = 10 % of DP reading
Flow error ≈ 10 ÷ 2 = 5 % of flow
The divide by two comes from the square root, since a small percentage error in DP gives roughly half that percentage in flow. This is why orifice loops are usually limited to about 4:1 or 5:1 for good accuracy.
Accuracy vs Repeatability
Accuracy tells you how close the reading is to the truth, while repeatability tells you how closely repeated readings agree under the same conditions. Our article on accuracy and precision shows the familiar target diagram, and Bronkhorst notes that both are expressed as a plus or minus percentage.
A meter can be very repeatable but consistently off, which is fine for control because a PID loop only needs a stable signal. For billing, custody transfer and mass balance, you need true accuracy, which means calibration against a traceable reference.
Flow Meter Accuracy by Type: Comparison Table
The Engineering ToolBox flowmeter selection guide lists typical accuracy and rangeability for common technologies. Always confirm the exact figure from the vendor datasheet for your size and model.
| Meter Type | Typical Accuracy | Typical Rangeability | Upstream Pipe |
|---|---|---|---|
| Coriolis mass | ±0.05 to 0.5 % of rate | 10:1 | None |
| Turbine | ±0.25 % of rate | 20:1 | 5 to 10 D |
| Electromagnetic | ±0.5 to 1 % of rate | 40:1 | 5 D |
| Vortex | ±1 % of rate | 10:1 | 10 to 20 D |
| Thermal mass | ±1 % of rate | 10:1 | None |
| Orifice plate | ±2 to 4 % of scale | 4:1 | 10 to 30 D |
| Ultrasonic | ±1 to 5 % of full scale | 10:1 to 20:1 | 5 to 30 D |
Notice that the high end meters quote percent of rate, while orifice and some ultrasonic meters quote percent of scale. For a detailed budget on a mass meter, see Coriolis uncertainty calculation, and for a magnetic flow meter check the minimum velocity, since mag meter specs often loosen at very low velocity.
Uncertainty Stack: From Meter to DCS
The meter spec is only the first item in the installed flow meter accuracy chain. A 4 to 20 mA loop adds transmitter output error, input card error and possibly a scaling mistake, and the installation adds its own share.
Independent errors are combined by root sum square rather than simple addition. The same method appears in our guide to measurement uncertainty in calibration.
Example in % of reading:
Meter 0.5, installation 0.3, signal chain 0.1
u = √(0.25 + 0.09 + 0.01)
u = √0.35 = ±0.59 %
A flow meter is usually calibrated on water or air at reference conditions. A wet calibration on the real fluid often gives a better installed result than a dry, calculated one, which is why many users specify it for critical meters.
Flow Meter Accuracy Troubleshooting Table
When a plant meter disagrees with a tank dip or a check meter, look at the installation and the process before blaming the sensor. The checklist below covers the causes that turn up most often, and our list of factors affecting flow meter readings goes further.
| Symptom | Likely Cause | Field Check |
|---|---|---|
| Reads high at low flow only | Full scale spec or zero offset | Zero the meter at no flow, compare spec in % of reading |
| Reads low, noisy | Swirl or short straight run | Check upstream diameters, add a flow conditioner |
| Error changes with temperature | Viscosity or density change | Check Reynolds number and compensation |
| DCS value differs from meter display | Wrong range or square root applied twice | Compare HART PV with DCS value |
| Step changes after maintenance | Gasket protrusion or reversed meter | Inspect flanges and flow arrow |
When the DCS and the local display disagree, read the digital PV over HART first. If the digital value matches the display, the problem is in the analog loop or the DCS scaling, not the meter.
- Accuracy basis confirmed: reading, full scale or span.
- Error converted to percent of reading at minimum, normal and maximum flow.
- Meter sized so normal flow sits in the upper half of the range where possible.
- Straight run and orientation meet the manual.
- Reynolds number within the calibrated region.
- DCS range, units and square root setting verified.
- Calibration certificate traceable and in date.
Sizing is where most accuracy is won or lost. Use our guide on flow meter selection and check the Reynolds number at both ends of the range before you order.
- Constant percentage error across the range.
- Honest performance at low flow.
- Easy to compare between vendors.
- Better for batching and mass balance.
- Often valid only above a stated minimum flow.
- Usually costs more than a full scale meter.
- May hide a separate zero stability term.
- Installed error can still exceed the spec.
MAX Machinery Accuracy Reading vs Full Scale PDF
Video on Calibrating Mass Flow Meters for High Accuracy
Flow Meter Accuracy FAQ
Multiply the percent of reading figure by the actual flow, then add the percent of full scale figure multiplied by the maximum flow. The result is the error band in flow units at that operating point.
Divide that band by the actual flow and multiply by 100 to get the error in percent of reading. Repeat it at minimum, normal and maximum flow for a fair picture.
A percent of reading error is a fixed percentage of whatever the meter is showing, so it shrinks in flow units as flow falls. A percent of full scale error is a fixed amount in flow units across the whole range.
At full scale both specs give exactly the same band. At one tenth of the range, a 1 percent of full scale spec becomes about 10 percent of the actual reading.
Accuracy describes how close the reading is to the true flow. Repeatability describes how closely the meter repeats the same reading when the flow and conditions stay the same.
A meter can be highly repeatable yet carry a steady bias, which calibration can correct. Control loops mostly need repeatability, while billing and custody transfer need true accuracy.
Coriolis mass meters are generally the most accurate for liquids, with typical figures from 0.05 to 0.5 percent of rate. Turbine and positive displacement meters also reach high accuracy on clean liquids.
The best choice still depends on fluid, size, pressure drop and turndown. A well installed magnetic meter is often the most practical accurate choice for conductive liquids.
Short straight runs, swirl, partly full pipes, entrained gas and buildup are common installation causes. Changes in viscosity, temperature and density can also move the meter away from its calibration.
On the signal side, analog output error and wrong DCS scaling add more. Always check the installation and the range settings before sending the meter for calibration.
Turndown is the ratio of the highest to the lowest flow over which the meter keeps its stated accuracy. A 10:1 meter rated for 100 m³/h holds its spec down to 10 m³/h.
Always read turndown together with the accuracy basis. A wide turndown on a full scale spec still means a large percentage error at the bottom of the range.
For general process control, plus or minus 1 to 2 percent of reading is usually adequate. For energy billing, mass balance or product transfer, users often look for 0.5 percent of reading or better.
Custody transfer meters usually need even tighter figures with a traceable calibration. Specify only what the application needs, because each step in accuracy adds cost.
Related Articles
- Turndown Ratio in Flow Meters
- Instrument Accuracy and Error
- Coriolis Flow Meter Uncertainty Calculation
- Types of Flow Meters
- Difference Between Accuracy and Precision
External References
- Tech Article 1022, Accuracy Reading vs Full Scale, MAX Machinery
- Accuracy: Full Scale vs Reading, Mass Flow Online
- Flow Measurement, Wikipedia
What We Learn Today
- Flow meter accuracy only makes sense with its basis, because a full scale spec gives fixed flow error while a reading spec keeps a constant percentage.
- Convert every spec into percent of reading at minimum, normal and maximum flow, adding reading and full scale parts when both are quoted.
- Installed error combines meter, installation and signal chain terms by root sum square, so check straight run and DCS scaling as well.