
A vendor's headline accuracy number is rarely the whole story. Base accuracy, zero stability, temperature effect, and pressure effect all stack together into the real total uncertainty, and the math to combine them correctly is simpler than it looks.
Manufacturers state accuracy as a total of base accuracy, zero stability, and operating effects, so the instrument engineer must calculate the real, combined uncertainty rather than quoting the base accuracy figure alone.
The word accuracy itself is used ambiguously by manufacturers to describe what is really their equipment's inaccuracy, or uncertainty. From this point on, this guide uses the more precise term uncertainty throughout, consistent with how pressure transmitter and other instrument specifications are properly interpreted.
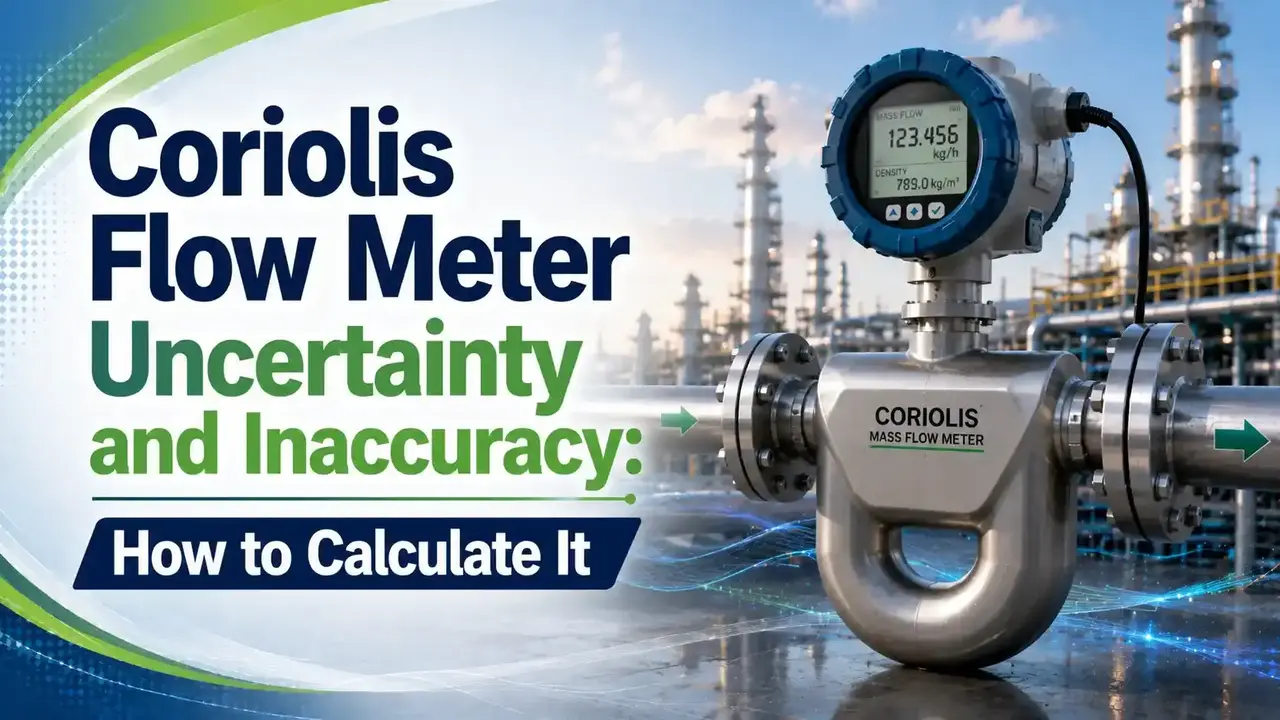
This guide covers the root sum square formula used to combine individual uncertainty components, a full worked numeric example using real vendor style specifications, why uncertainty grows as flow rate drops, and typical uncertainty by turndown ratio for both liquid and gas service.
How to Calculate Coriolis Flow Meter Uncertainty
The total uncertainty of a Coriolis flow meter is expressed as the combination of its individual component uncertainties, using a root sum square approach.
- cₙ is the sensitivity coefficient of each component (typically 1, unless the vendor states otherwise)
- Uxₙ is the standard uncertainty of each individual component
- Ux is the total standard uncertainty
This is the same root sum square logic used to combine independent error sources across instrumentation generally, similar to how multiple contributors are combined in a measurement units context.
Worked Example: Calculating Total Uncertainty
Consider a Coriolis flow meter in liquid service with a maximum flow of 3200 lb/min, calibrated at 30 psig and 25°C, but operating at 250 psig and 41.67°C, a calibration versus operating condition gap similar to what drives RTD temperature calibration error too. The vendor catalog states:
- Base accuracy: 0.1% of flow rate
- Zero stability: 0.08 lb/min
- Operating temperature effect: 0.0005% of max flow rate per 1°C
- Operating pressure effect: 0.0008% of flow rate per psi
At maximum flow, the temperature effect contributes 0.0005% × 3200 lb/min × (41.67 − 25)°C = 0.267 lb/min, or 0.01% of flow rate. Combining base accuracy, zero stability, temperature effect, and pressure effect using the root sum square formula gives a total standard uncertainty of 0.101%.
Doubling that standard uncertainty for a 95% confidence level, since the vendor did not explicitly state a confidence level, gives a total expanded uncertainty of 0.202% of mass flow rate at maximum flow.

🧮 Interactive Coriolis Uncertainty Budget Calculator
Enter your own vendor specifications to calculate total standard and expanded uncertainty at any flow rate.
Why Uncertainty Grows at Lower Flow Rates
Zero stability is expressed as a fixed flow rate value, like 0.08 lb/min, not a percentage. At maximum flow, that fixed value is a tiny fraction of the reading. At low flow, the same fixed value becomes a much larger percentage of the actual reading, which is exactly why Coriolis meter uncertainty rises sharply as flow rate drops toward the bottom of its range.
This is also why an instrument engineer should consider in situ zeroing wherever process temperature and pressure differ meaningfully from calibration conditions, similar in spirit to the temperature compensation approach covered in our guide to thermocouple and RTD installation.
A Coriolis meter's spec sheet accuracy is only true at one flow rate, one temperature, and one pressure. Everywhere else on its range, the real uncertainty has to be calculated, not read off the label.
Typical Uncertainty by Turndown Ratio
| Service | Turndown Ratio | Typical Uncertainty |
|---|---|---|
| Liquid | 1:20 | 0.3% of mass flow rate |
| Liquid | 1:50 | 0.5% of mass flow rate |
| Liquid | 1:100 | 1% of mass flow rate |
| Gas | 1:10 | 1% of mass flow rate |
| Gas | 1:20 | 2% of mass flow rate |
Gas applications generally carry higher uncertainty than liquid applications, since gas has lower density and therefore a higher fluid velocity for the same mass flow rate, a distinction that also shows up when comparing flow meter reading stability factors across different meter technologies.
Watch: Coriolis Flow Meter Accuracy Adjustment
This video covers how Coriolis flow meter accuracy is adjusted through field calibration once real operating conditions diverge from factory calibration.
Video: "Accuracy Adjustment of Coriolis Flow meter, Coriolis Flowmeter Calibration Method", via YouTube.
FAQs on Coriolis Flow Meter Uncertainty
You May Also Like
What Factors Affect the Stability of Flow Meter Readings?
Uncertainty and stability are related but distinct concerns. This companion guide covers the 15 practical factors, from air bubbles to electrical interference, that can destabilize a flow meter reading day to day, along with the fixes for each.
Read Full Article →External References
- ISO 5168:2005, Measurement of Fluid Flow, Procedures for the Evaluation of Uncertainties
- Coriolis Flow Meter, Wikipedia
- Measurement Uncertainty, Wikipedia
What we learn today
- Total Coriolis flow meter uncertainty combines base accuracy, zero stability, temperature effect, and pressure effect using a root sum square formula, not simple addition.
- A worked example at maximum flow gives a 0.101% standard uncertainty and 0.202% expanded uncertainty at 95% confidence, using realistic vendor style specifications.
- Zero stability's fixed value becomes a larger fraction of the reading at low flow, which is why uncertainty rises sharply toward the bottom of the meter's range.
- Typical uncertainty ranges from 0.3% at a 1:20 turndown for liquid service up to 2% at a 1:20 turndown for gas service.
- In situ zeroing under real operating conditions reduces the temperature and pressure related contributions to total uncertainty.