
Two simple graphs of gain and phase against frequency tell you whether an amplifier, power supply or control loop will settle or oscillate.
Frequency response shows how a system treats signals of different frequencies. Plotting gain and phase on log scales turns complicated transfer functions into straight line sketches that engineers read at a glance.

What Is a Bode Plot?
A Bode plot is a pair of graphs that show the magnitude, in decibels, and the phase, in degrees, of a system transfer function against frequency on a logarithmic axis. It was introduced by Hendrik Bode at Bell Labs and remains the standard tool for amplifier, filter and control loop design.
Magnitude in dB equals 20 × log10 of the gain ratio. A gain of 10 is 20 dB, a gain of 1 is 0 dB and a gain of 0.1 is minus 20 dB.
Log scales turn multiplication into addition, so each pole and zero adds its own simple curve. The total response is just the sum.
Phase describes the time shift between input and output, as explained in phase angle in AC circuits. Too much phase lag at the wrong frequency causes oscillation.
Pole and Zero Building Blocks
| Element | Magnitude Slope | Phase Change | Where |
|---|---|---|---|
| Constant gain K | Flat at 20 log K | 0° | All frequencies |
| Integrator 1 ÷ s | Minus 20 dB per decade | Minus 90° | All frequencies |
| Real pole | Minus 20 dB per decade after fc | 0° to minus 90° | 0.1 fc to 10 fc |
| Real zero | Plus 20 dB per decade after fz | 0° to plus 90° | 0.1 fz to 10 fz |
| Double pole | Minus 40 dB per decade | 0° to minus 180° | Around fn |
At the corner frequency of a single pole, the true magnitude is 3 dB below the straight line and the phase is minus 45°. These two numbers are worth remembering.
An RC low pass filter is the simplest single pole example. Its corner sits at 1 ÷ (2π RC).
5 Easy Steps to Sketch a Bode Plot
Straight line Bode plot asymptotes are accurate within 3 dB for real poles. Software then refines the curve for complex poles, where peaking appears.
Measure a real circuit with a frequency response analyser, or with a signal generator and an oscilloscope stepping through frequencies.
Gain Margin and Phase Margin
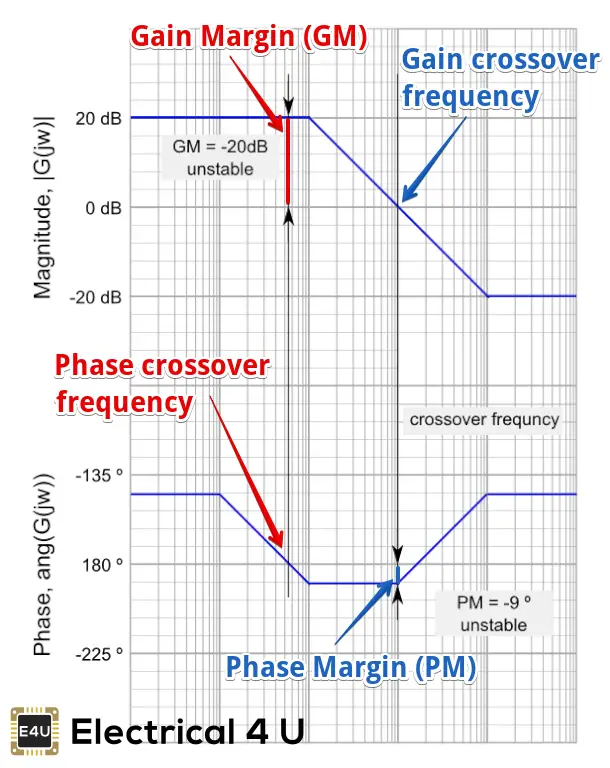
Electrical4U explains that gain margin is how much the gain can rise before instability, read at the phase crossover. A phase of minus 120° at gain crossover gives a phase margin of 60°.
Positive margins mean a stable closed loop, zero means marginal and negative means unstable. Common targets are at least 45° phase margin and 6 dB to 10 dB gain margin.
Gain margin GM = minus |L| in dB at phase crossover
Example loop, K = 100, poles at 10 Hz, 1 kHz, 10 kHz:
Gain crossover ≈ 784 Hz, phase ≈ minus 131.9°
PM ≈ 48.1°, phase crossover ≈ 3180 Hz, GM ≈ 20.9 dB
Bode Plot in Real Designs
Op amps are compensated so their open loop Bode plot falls at 20 dB per decade through crossover, see op amp basics. Power supply designers use the same method on a buck converter feedback loop.
Process engineers read phase margin as robustness, which ties directly to PID tuning parameters. Low margin shows up as overshoot and ringing.
Loop Stability Calculator
Raise K to 1000 and watch both margins shrink until the loop turns unstable. Moving pole 2 higher restores margin.
- Easy straight line sketches.
- Shows bandwidth and margins at once.
- Works with measured data.
- Adds effects of stages simply.
- Assumes linear systems.
- Hard to read with multiple crossovers.
- Time response only implied.
- Right half plane zeros need care.
MIT Gain and Phase Margin Lecture PDF
Gain and Phase Margin Video
Bode Plot FAQ
Related Articles
- PID Controller Tuning Guide
- RC Low Pass and High Pass Filter
- Op Amp Basics
- Phase Angle in AC Circuits
- How to Tune a PID Controller
External References
- Gain and Phase Margins Lecture, MIT OpenCourseWare
- Gain Margin and Phase Margin, Electrical4U
- Bode Plot, Wikipedia
What We Learn Today
- A Bode plot shows gain and phase on log frequency axes.
- Poles and zeros add simple slopes that sum into the full response.
- Phase margin and gain margin measure how far a loop is from oscillation.