
Every positioner, converter and on off actuator in a plant draws a little air, and together they decide the size of the compressor, dryer, receiver and header. Getting the total right keeps valves responsive and avoids a costly shortage after start up.
Control valves stop moving when the air header collapses, so the air system must be sized from a careful demand estimate. This guide shows how to build an instrument air consumption figure and turn it into compressor, receiver and header sizes.

What Is Instrument Air Consumption?
Instrument air consumption is the total flow of clean, dry compressed air needed by all pneumatic instruments and actuators in a plant, usually expressed in Nm³/h or scfm. It includes the steady bleed of positioners and converters, the air used each time a valve strokes, purges, and an allowance for leaks and growth.
Most of this air feeds control valves through a valve positioner, so the valve list is the starting point of the calculation. On off valves with solenoid valves add short bursts of demand each time they open or close.
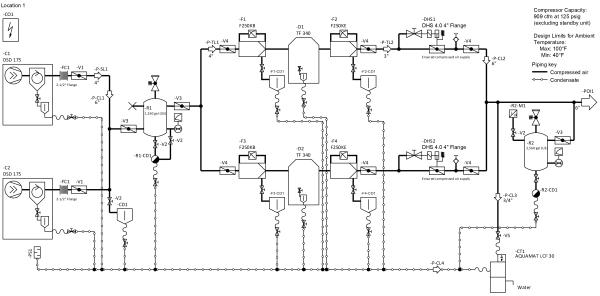
The sketch above shows the usual chain of compressor, aftercooler, receiver, dryer and filters before the air reaches the plant header. Each of these items is sized from the same demand figure, so an error at the start spreads through the whole design.
Where the Air Goes in a Process Plant
Pilot relays bleed a small flow all the time, even when the valve is still.
Flapper nozzle converters also bleed continuously.
Air to fill the actuator each time it moves.
Small steady flows for level bubblers and analyzer or panel purges.
Desiccant dryers use part of the dried air to regenerate.
Sebesta Blomberg engineer Bruce Bullough gives examples from manufacturer data: one I/P converter needed 1.02 Nm³/h (0.60 scfm) and another 0.59 Nm³/h (0.35 scfm). A valve positioner bled 1.21 Nm³/h (0.71 scfm) at steady state but used 21.4 Nm³/h (12.6 scfm) while adjusting position.
Modern low bleed digital positioners use much less air than older designs, so always take figures from the actual datasheet. Power Engineering notes that desiccant dryer purge air consumes about 15 to 20 percent of compressor capacity, a loss that must be added on top of the instrument air consumption.
A positioner can use more than ten times its steady bleed while it is moving the valve, as Bullough shows with 1.21 Nm³/h at rest and 21.4 Nm³/h during adjustment. This is why a header sized only on steady bleed can sag during a plant upset.
Air Quality Required by ISA 7.0.01
| Parameter | ISA 7.0.01 Requirement | Why It Matters |
|---|---|---|
| Pressure dew point | At least 10 °C below the lowest ambient, never above 4 °C at line pressure | Stops water and ice in tubing |
| Particle size | Maximum 40 micrometres | Protects nozzles and relays |
| Oil content | Maximum 1 ppm w/w, liquid and vapour | Prevents gummy deposits |
| Contaminants | Free of corrosive, flammable or toxic gases | Protects people and parts |
Compressed Air Best Practices summarises these four limits of ISA 7.0.01, and Bullough adds that many plants specify a dew point of minus 40 °C, rarely higher than minus 20 °C. The risks of wet air are explained in dew point in instrument air and water vapour in instrument air lines.
How to Calculate Instrument Air Consumption in 7 Steps
Steps 1 to 4 give the real instrument air consumption, while steps 5 and 6 cover uncertainty and growth. Keep the margins visible in the sheet, so reviewers can see what is demand and what is allowance.
Ask valve vendors for steady state air consumption at your actual supply pressure, not at their test pressure. Bleed rises with supply pressure, so a figure quoted at 1.4 bar can understate use at 4 bar.
Demand Formula and Worked Example
Q design = Q steady × (1 + leak ÷ 100) × (1 + margin ÷ 100)
Q compressor = Q design ÷ (1 minus purge ÷ 100)
Example:
40 positioners × 1.2 Nm³/h = 48 Nm³/h
20 on off valves × 0.5 Nm³/h average = 10 Nm³/h
Q steady = 58 Nm³/h
Q design = 58 × 1.10 × 1.20 = 76.6 Nm³/h
Q compressor = 76.6 ÷ 0.85 = 90.1 Nm³/h
Here 0.5 Nm³/h is an assumed average stroking demand per on off valve over a busy hour, and 15 percent is an assumed desiccant dryer purge. Replace both with your own datasheet values.
Instrument Air Consumption Calculator
Second Worked Example: Air Used per Valve Stroke
An on off ball valve has a double acting actuator with a swept volume of 5 litres, supplied at 6 bar gauge. The free air per stroke is 5 × (6 + 1.013) ÷ 1.013 = 34.6 litres, about 0.035 Nm³.
If the valve cycles 10 times in an hour, it uses about 0.35 Nm³/h on average, but the peak during each stroke is much higher. Bullough notes a minimum of 0.0012 m³ (73 cubic inches) per operation for a spring less ball valve actuator, and the actuator styles are compared in valve actuator types.
A spring return actuator uses air only to compress the spring, while a double acting actuator fills one side on every stroke in each direction. Choosing the actuator style and fail position therefore changes the instrument air consumption of a batch plant.
Sizing the Air Receiver
Q in Nm³/min, t in minutes, pressures in bar
Example:
Q = 76.6 ÷ 60 = 1.28 Nm³/min, t = 5 min
P1 = 7 bar g, P2 = 4.5 bar g, Pa = 1.013 bar
V = 1.28 × 5 × 1.013 ÷ 2.5 = 2.6 m³
The receiver holds enough air to let valves reach their safe position or let a standby compressor start after a trip. The hold up time t comes from the project or client standard, and the minimum pressure P2 is the lowest supply at which every fail safe valve still works.
Header and Distribution Sizing
Bullough recommends a typical plant air pressure around 6 bar, rarely above 8 bar, and his example header came out at 80 mm, so a 3 inch pipe was selected. Use the method in calculate pressure drop in pipes to keep the drop across the farthest branch small at peak flow.
A ring main feeds each consumer from two directions and keeps pressure steadier than a dead end line. Instrument branches usually end in a pneumatic manifold or individual filter regulators near the valves.
Fit a pressure transmitter at the far end of the header, not only at the compressor. It shows the true pressure the valves see and gives an early alarm before positioners starve.
Instrument Air System Review Checklist
- Every positioner, I/P converter and on off valve is counted from the latest index.
- Bleed values are taken at the actual supply pressure.
- Stroking demand of large and frequently cycling valves is included.
- Leakage and future margins are stated separately.
- Dryer purge loss is added to compressor capacity.
- Receiver hold up time meets the project standard.
- Header pressure drop is checked at peak flow.
- Dew point, particle and oil limits match ISA 7.0.01.
Compressors themselves are covered in single stage and multi stage compressors, and a valve that hunts or chatters can burn air steadily, as shown in control valve troubleshooting. Partial stroke tests on ESD valves, described in partial stroke testing, also draw short bursts of air.
- Right sized compressor and dryer with lower energy use.
- Stable header pressure during upsets.
- Valves reach safe positions after a compressor trip.
- Clear record for future plant expansion.
- Stroking demand depends on how the plant is operated.
- Datasheet bleed varies with supply pressure.
- Leakage grows with age and is hard to predict.
- Margins can oversize equipment if stacked carelessly.
Ways to Reduce Air Use
Even a few low bleed retrofits can free compressor capacity for new valves, which is cheaper than adding a machine. For the valve side of such projects, see control valve sizing requirements.
Instrument Air Piping Design Paper
Instrument Air Compressor Video
Instrument Air Consumption FAQ
It is the total flow of clean, dry compressed air used by all pneumatic instruments and actuators in a plant. Instrument air consumption is normally stated in Nm³/h or scfm at reference conditions.
It covers positioner bleed, converters, valve stroking, purges and leaks. This total then sets the size of the compressor, dryer, receiver and header for the plant.
Bullough quotes one positioner at 1.21 Nm³/h at steady state, rising to 21.4 Nm³/h while moving. Modern low bleed digital positioners can use far less than older relay designs.
Always take the figure from the datasheet at your real supply pressure for the instrument air consumption sheet. Bleed rises as supply pressure goes up, so test pressure values can mislead.
Each stroke fills the actuator volume with air at supply pressure in a few seconds. During a plant upset many valves move together and the flow peaks sharply.
The receiver and header must cover that peak without dropping below the minimum pressure. Steady bleed alone hides this short but heavy demand on the air system.
It sets a pressure dew point at least 10 °C below the lowest ambient, and never above 4 °C at line pressure in any case. It also limits particles to 40 micrometres in the air stream.
Total oil content must stay below 1 ppm by weight, and the air must be free of corrosive or toxic gases. Many plants specify a dew point of minus 40 °C for extra safety.
Use V = Q × t × Pa ÷ (P1 minus P2) with flow in Nm³/min and time in minutes. P1 is the normal pressure and P2 the lowest pressure at which valves still work.
For 1.28 Nm³/min, 5 minutes and a 2.5 bar drop, the receiver needs about 2.6 cubic metres of volume. The hold up time itself comes from the project standard.
Yes, because a desiccant dryer uses part of the dried air to regenerate its beds. Power Engineering puts this purge at about 15 to 20 percent of compressor capacity.
Divide the design demand by one minus the purge fraction to get the compressor size. Dew point dependent purge control can reduce this loss a great deal.
Most projects add a leakage allowance and a separate future margin to the instrument air consumption. Typical values come from the client standard, such as 10 percent leakage and 20 percent growth.
Keep each margin visible in the sheet rather than hiding it inside bleed values. Stacked hidden margins often lead to oversized compressors that waste energy.
Related Articles
- Control Valve Positioner Working
- Dew Point in Instrument Air Risks
- Water Vapour in Instrument Air Lines
- Single Stage and Multi Stage Compressor
- Valve Actuator Types and Applications
External References
- Piping Design of Instrument Air Distribution Systems, Bruce D. Bullough
- Understanding the ISA 7.0.01 Instrument Air Standard, Compressed Air Best Practices
- Compressed Air Dryer, Wikipedia
What We Learn Today
- Instrument air consumption adds positioner and I/P bleed, valve stroking demand and purges, then applies leakage and future margins before sizing equipment.
- A positioner may bleed about 1.2 Nm³/h at rest yet use over 20 Nm³/h while moving, so peaks must be covered by the receiver.
- ISA 7.0.01 limits dew point to 4 °C at line pressure, particles to 40 micrometres and oil to 1 ppm in instrument air.