
Machines and batches run in ordered steps, yet ladder code often hides that order inside latches and flags. A flowchart style language puts every step and condition on the screen where anyone can follow it.
SFC is the IEC 61131 3 language for sequences. It shows a process as boxes for steps and bars for transitions, with actions attached to each step.
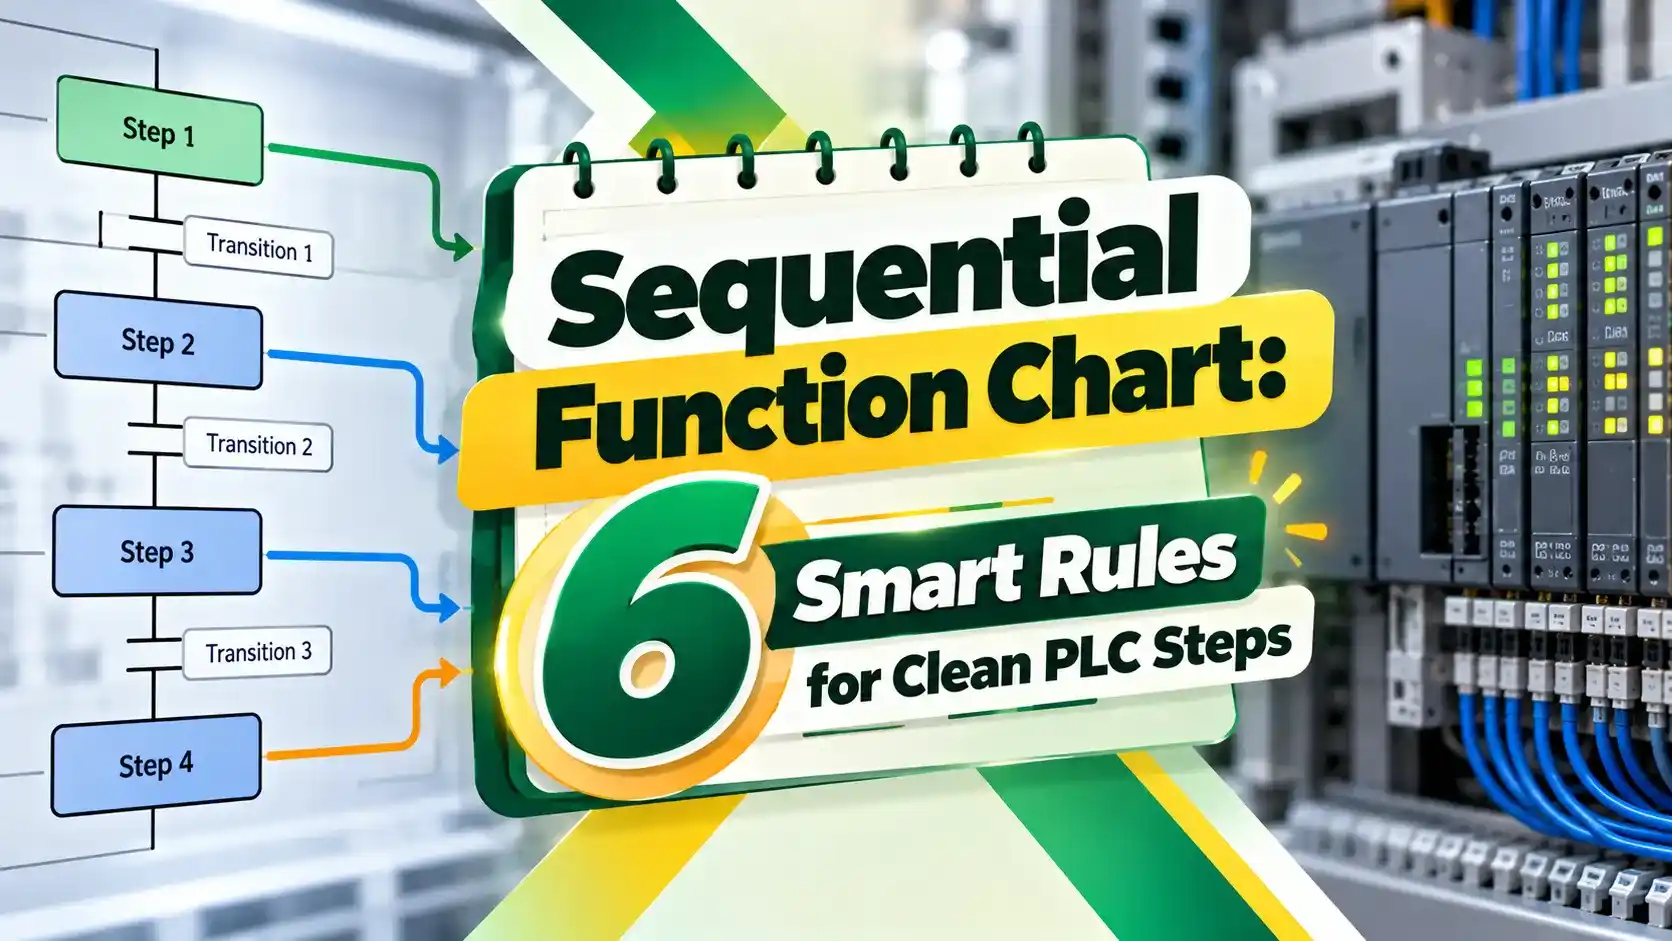
What Is a Sequential Function Chart?
A sequential function chart is a graphical PLC language from IEC 61131 3 that describes a process as a series of steps connected by transitions, with actions executed while each step is active. It sits beside the other PLC programming languages and is based on the French GRAFCET method.
Control.com explains that a transition must separate any two steps, and a step must separate any two transitions. This strict alternation keeps sequences unambiguous.
Only active steps run their actions, so the controller does less work each scan. The overall behaviour is a classic sequential system, where the next state depends on the present one.
The initial step, drawn with a double box, becomes active at start up. Every other step waits for its incoming transition to be true.
Building Blocks
A box representing one stage of the process.
A bar with a Boolean condition to move on.
Code attached to a step, with a qualifier.
Split into parallel or alternative paths.
Action code is usually written in ladder or structured text inside the step. Qualifiers decide how long an action lasts.
| Qualifier | Meaning | Typical Use |
|---|---|---|
| N | Non stored, active while the step is active | Run a pump during fill |
| S | Set, stays on after the step ends | Latch an alarm |
| R | Reset a stored action | Clear the latch |
| P | Pulse for one scan | Increment a counter |
| L | Time limited | Pulse a valve for 5 s |
| D | Time delayed | Start after a delay |
Parallel and Selective Branches
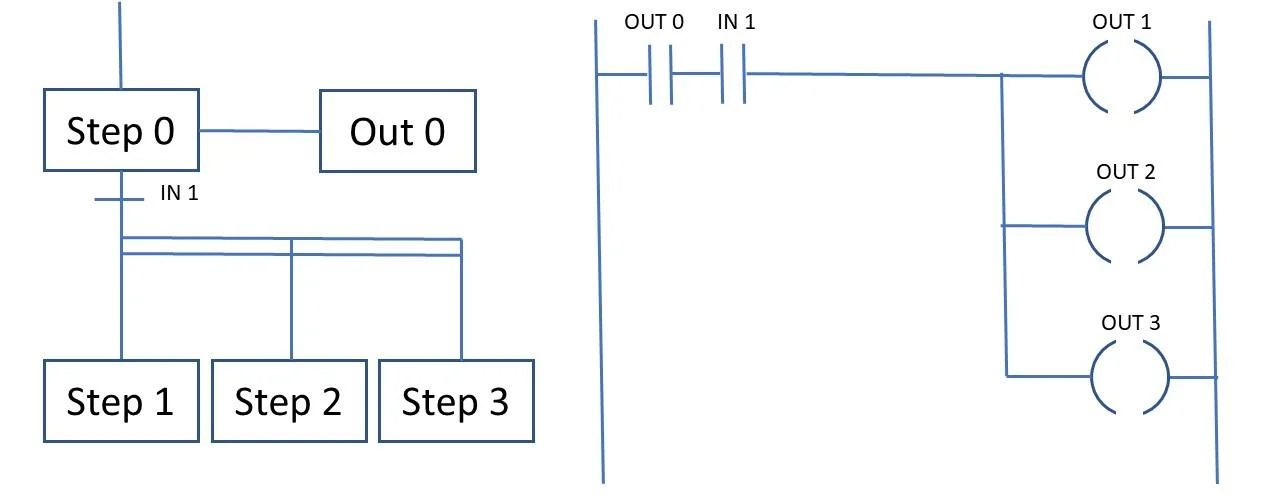
Control.com describes parallel branches as simultaneous paths and selective branches as alternatives, each with its own transition. A parallel branch always closes with a double line that waits for every path to finish.
Selective branches are ideal for recipe choices in ISA 88 batch control. Parallel branches suit machines where two axes move at the same time.
6 Smart Sequential Function Chart Rules
Step supervision timers are simple TON timers compared with a maximum expected time. They point operators straight to the stuck condition.
Emergency stops and permissives must never depend on the active step. Handle faults with the methods in PLC fault handling.
Cycle Time Formula
Cycles per hour = 3600 ÷ Cycle time
Example, four step washing sequence:
Fill 40 s, Wash 120 s, Drain 30 s, Spin 60 s
Transition delays ≈ 10 s in total
Cycle = 260 s, about 13.8 cycles per hour
Parallel branches take the time of their slowest path, not the sum. Moving slow operations into parallel paths is a quick way to raise throughput.
Record real step times from the controller to find the true bottleneck.
Cycle Time Calculator
Try halving the wash time to see the gain. Then check whether quality still meets specification.
- Sequence is visible at a glance.
- Easy to find the stuck step.
- Only active steps are scanned.
- Natural fit for batch recipes.
- Not ideal for continuous control.
- Large charts become cluttered.
- Vendor support varies.
- Needs discipline with abort logic.
Continuous loops stay in function blocks, as in DCS control strategies. The chart then calls those loops by changing their modes or set points.
B and R SFC Training PDF
SFC for Beginners Video
Sequential Function Chart FAQ
Related Articles
- PLC Programming Languages
- ISA 88 Batch Control
- Ladder Logic for Beginners
- PLC Timer Instructions
- How the PLC Scan Cycle Works
External References
What We Learn Today
- A sequential function chart shows steps, transitions and actions visually.
- Parallel and selective branches model simultaneous and alternative paths.
- Step timers and separate interlocks keep sequences safe and easy to debug.