
A historian that once fit comfortably on a single drive can quietly balloon into millions of records a week, slowing trends, delaying alarms, and pushing query times from seconds into minutes.
A SCADA Database Growing Too Fast is almost always a configuration problem rather than a genuine data volume problem, and it responds well to a handful of targeted fixes.
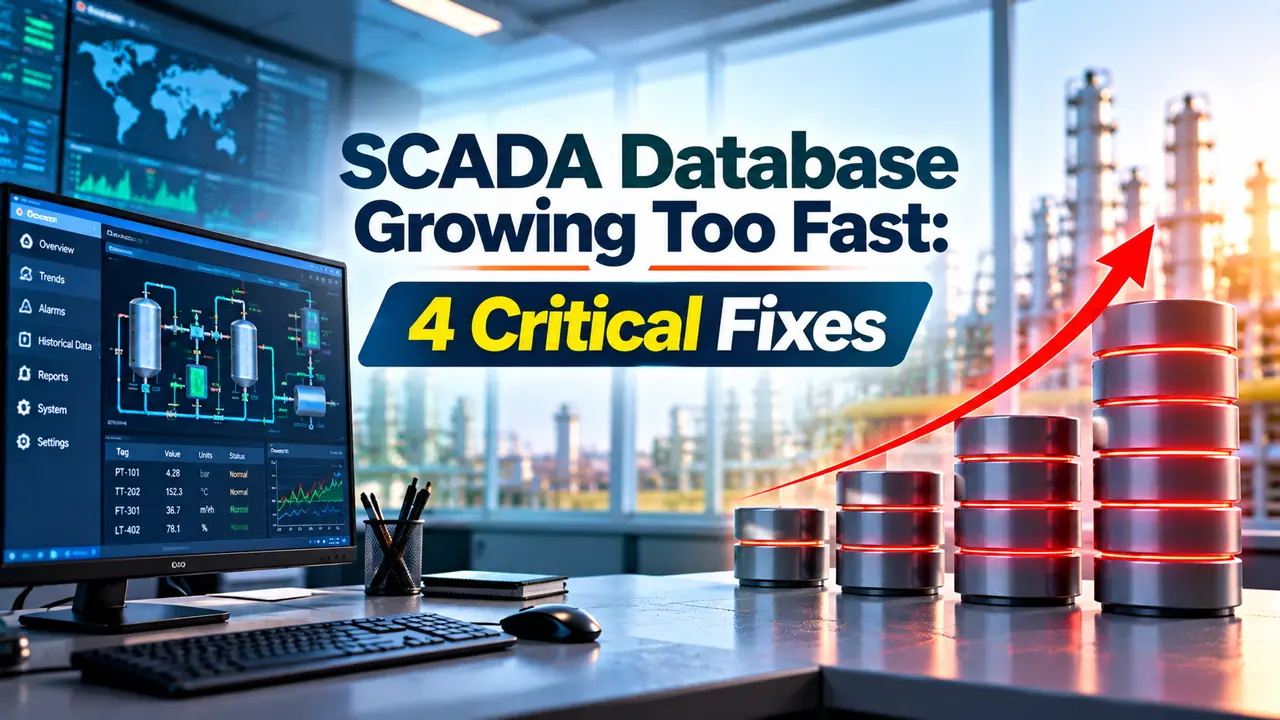
A SCADA Database Growing Too Fast usually traces back to over logging, unneeded tags, missing retention policy, or alarm flooding, and every one of those four causes has a practical, well understood fix.
Left unmanaged, that simple behavior is exactly what turns a modest plant into a multi million record archive within a matter of weeks rather than years.
4 Causes Behind a SCADA Database Growing Too Fast
Each of these causes is individually manageable, which is exactly why a SCADA Database Growing Too Fast is rarely a sign that more storage hardware is the real answer.
How Exception Reporting and Compression Cut Storage
These two filters work in sequence, exception reporting trims data before it ever leaves the source device, and compression trims what is left before it commits to the historian archive, which is exactly how a platform like the PI Data Archive keeps storage growth reasonable.
Neither filter deletes information that actually matters, both are built specifically to preserve the shape of a trend while discarding the countless repeated or insignificant points sitting between genuine changes in value.
A signal that never moves, a tank sitting at a steady level for a full shift, is exactly the case where these settings save the most storage, since a naive fixed interval logger would otherwise write the same unchanged value thousands of times over.
Symptoms Worth Recognizing Early
| Symptom | What Is Actually Happening |
|---|---|
| Slow trend and screen updates | Queries scan far more raw rows than the display actually needs |
| Delayed alarm and event lists | The event table has grown large enough that indexing can no longer keep pace |
| High disk I/O during reports | Report queries pull months of uncompressed history instead of summarized data |
| Backup jobs taking far longer | Backup size has crept up in step with unmanaged raw data growth |
None of these symptoms show up overnight, which is precisely why the underlying growth problem so often gets noticed only after performance has already degraded noticeably.
Raw Storage vs a Tiered Retention Policy
Tiered Retention
Keeps recent raw data fast to query while rolling older values into summarized or archived storage, controlling long term growth.
Keep Everything Raw
Simple to configure at first, but storage, backup time, and query latency all climb together with no natural ceiling.
Auditing Tags Before the Growth Problem Gets Worse
A quarterly tag audit costs very little time compared with the alternative, which is discovering the growth problem only once queries have already slowed down across the whole system.
Assigning clear ownership for that audit, rather than leaving it as an unassigned task everyone assumes someone else is handling, is often the single change that makes the habit actually stick.
Building a Monitoring Habit Around Storage Growth
Trending database size and disk usage over months, rather than only checking it when something already feels slow, is what turns a surprise outage into a planned maintenance task.
A simple weekly log of total archive size, free disk space, and average query response time reveals a growth trend long before it becomes a genuine capacity problem.
Pairing that trend with a record of which tags were added or changed lets a team connect a sudden growth spike back to its actual cause, rather than guessing at it months later.
Reviewing this trend alongside the quarterly tag audit closes the loop, since the audit fixes known issues while the trend catches anything new before it grows large enough to matter.
A Practical Checklist for Controlling Historian Growth
Any regulated environment tracking raw retention requirements should apply that policy on top of these fixes rather than instead of them, since compliance retention and performance tuning solve two genuinely different problems.
How Common Historian Platforms Handle Growth
Every one of these platforms gives an engineer the tools to control growth, the tools simply sit unused far more often than they should on a system that was commissioned in a hurry and never revisited.
Swapping platforms rarely solves a growth problem on its own, since the same tag left logging every second with no deadband will overwhelm a new historian just as quickly as the old one.
Hardware Sizing: What Actually Needs to Scale
Once logging is properly filtered, the remaining hardware conversation becomes much simpler, since the system is no longer fighting an unbounded and unnecessary data stream.
A system sized correctly for its filtered, well managed data volume tends to stay comfortably ahead of demand for years, while one sized around raw unfiltered logging is fighting a losing battle from the very first day it goes live.
Documenting the assumptions behind a hardware sizing decision, expected tag count, expected logging rate, expected retention window, gives the next engineer something concrete to check when growth eventually does outpace the original plan.
Regulated Environments and Raw Data Retention
A pharmaceutical, food, or other regulated plant often carries a formal requirement to keep certain raw records for a defined number of years, which changes how aggressively compression and purging can be applied.
In that setting, the fix usually is not less filtering, it is a clearer split between operational data tuned for performance and compliance data retained exactly as required, stored and managed as two separate concerns.
A retention policy written without checking applicable regulatory requirements first is a policy that will eventually need to be rewritten under pressure, so that check belongs at the very start of the project rather than at the end.
Involving the quality or compliance team early, before storage settings are finalized, avoids the awkward situation of discovering months later that a compression setting quietly discarded a value an auditor now needs to see during a review.
Watch: OSIsoft Exception and Compression Quick Summary
Questions Engineers Ask About a Growing Historian
Related Articles on This Site
- SCADA Historian Integration, OSIsoft PI and AVEVA Architecture
- SCADA Tag Database Design
- DCS Historian Explained, Data Storage
- What Is a Process Historian
- SCADA Alarm Management
External References
What We Learn Today
- A SCADA Database Growing Too Fast almost always traces back to over logging, unneeded tags, missing retention, or alarm flooding.
- Exception reporting and compression work together, filtering data at the source and again just before it reaches the archive.
- A written retention policy with tiered storage controls long term growth far better than deleting data outright or adding more disk space.