
A P&ID tells you what a control loop does, but it cannot tell a technician which terminal to lift at two in the morning. The instrument loop drawing fills that gap by showing every wire, cable, junction box and I/O channel from the sensor to the operator screen.
An instrument loop diagram is the most detailed drawing of a single control loop, tracing each signal from the field device to the control system. This guide explains the ISA 5.4 contents, how to read the signal path and how to use the drawing for loop checks.

What Is a Loop Diagram?
A loop diagram is a drawing that shows one complete instrument loop, with every device, terminal, cable, junction box, cabinet and control system channel it passes through. It takes a single loop from the piping and instrumentation diagram and adds all the wiring and tubing detail needed to build, test and maintain it.
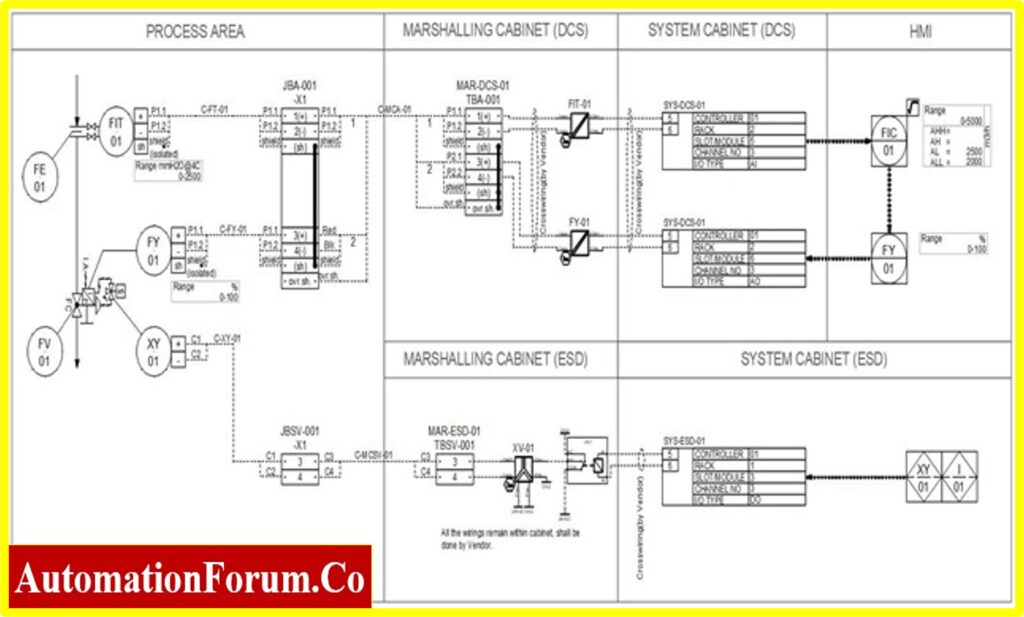
The ISA 5.4 standard, Instrument Loop Diagrams, gives guidelines for preparing and using these drawings. ISA states that its purpose is to improve communication among design, construction, operating and maintenance personnel, and its scope covers chemical, petroleum, power, metal refining and many other industries.
Most loops carry a 4 to 20 mA current loop signal, a discrete contact or a fieldbus segment. Whatever the signal, the drawing answers one question clearly: exactly where does each conductor go.
Loop Diagram Compared With Other Design Drawings
| Drawing | Main Purpose | Shows Terminals? | Main User |
|---|---|---|---|
| P&ID | Process flow and control philosophy | No | Process and design engineers |
| Instrument index | List of every tag with key data | No | Whole project team |
| Hook up drawing | Process and pneumatic connection of one device | No | Mechanical fitters |
| Cable schedule | Cable tags, sizes and routes | Cable ends only | Electrical contractor |
| Loop diagram | Complete wiring path of one loop | Yes, every terminal | Technicians and commissioning |
The control.com Lessons in Industrial Instrumentation textbook calls the loop sheet the most detailed form of diagram for a control system as a whole. It notes that cable numbers, wire colours, junction block numbers, panel identification and even grounding points are all shown.
On a typical ISA style loop sheet the field devices are drawn on the left and the control room equipment on the right. Reading from left to right therefore follows the signal from the process to the operator.
8 Essential Contents of an ISA 5.4 Loop Diagram
Many owners add optional data such as calibration range, alarm set points, HART address and I/O rack, slot and channel. The fail safe convention used for valves is explained in fail safe valve positions.
According to the control.com textbook, each instrument on the sheet also carries its input and output calibration range. This lets a technician confirm that a known input produces the expected output at every point of the chain.
Before a loop check, compare the tag numbers on the drawing with the physical tags in the field and in the DCS database. A single mismatched digit is the most common reason a loop check fails.
Tracing the Signal From Field to DCS
In a typical plant, each field device is wired with a single pair cable to a local junction box, and a multipair cable runs from there to the control building. Cable types and screening practice are discussed in shielded cable and twisted pair.
Inside the building, the multipair lands in a marshalling cabinet where cross wiring moves each signal to the correct I/O channel. The layout and purpose of these panels are covered in marshalling cabinet DCS wiring.
From marshalling, a system cable or prefabricated harness connects to the I/O card, whose type is chosen from those listed in DCS I/O card types. The loop diagram records the rack, slot and channel so that a technician can go straight to the right point.
Screens are normally earthed at one end only, usually in the control room, and the loop diagram shows exactly where. The reasons are explained in earthing aspects in industrial process plants.
Automation Forum lists four common loop drawing families on large projects: DCS loops, emergency shutdown loops, fire and gas loops and system interconnection drawings. Each family usually has its own title block and numbering series.
Terminal, Cable and Junction Box Numbering
Good numbering makes a loop diagram readable without a legend. A common scheme gives cables the loop tag with a suffix, junction boxes a JB number by area and signal type, and terminals a strip letter plus a number.
Core colours follow the project cable specification, and typical Indian and international practice is summarised in cable colour codes for field instruments. Positive and negative must be shown on every terminal, since reversed polarity is a frequent commissioning fault.
Keep intrinsically safe loops in separate junction boxes, cables and terminals with blue marking. The loop sheet should show the barrier or isolator and its entity parameters clearly.
The difference between intrinsically safe and flameproof protection, and why segregation matters, is described in explosion proof vs intrinsically safe instruments.
Common Loop Types on a Project
Loop powered transmitter fed from the I/O card or a power supply.
Card drives 4 to 20 mA into a positioner or I/P converter.
Dry contact or NAMUR sensor read by a discrete card.
Card energises a solenoid or relay through an interposing relay.
Separate SIS card, cable and junction box, often redundant.
A 4 wire transmitter has its own power supply and needs extra conductors on the drawing, as shown in 2 wire and 4 wire transmitters. Digital loops often include an interposing relay whose coil and contact terminals must both appear.
Loop Voltage Budget Formula
Every 2 wire loop diagram hides a small calculation: the supply must still leave enough voltage at the transmitter after the drops across the receiver resistor, the cable and any barrier. The loop sheet gives the lengths and devices you need to check it.
Voltage at transmitter = Supply minus Current × Total loop resistance
Example:
Supply 24 V, receiver 250 Ω, 800 m of cable at 18 Ω per km, no barrier
Cable resistance = 2 × 0.8 × 18 = 28.8 Ω
Total loop resistance = 250 + 28.8 = 278.8 Ω
Drop at 20 mA = 0.020 × 278.8 = 5.58 V
Voltage at transmitter = 24 minus 5.58 = 18.42 V, margin 7.92 V over 10.5 V
The same budget is worked out in more depth in the HART loop voltage budget calculator. The effect of loop impedance on accuracy is discussed in instrument loop impedance.
Loop Voltage Calculator
Second Worked Example: Long Cable With a Barrier
Now add an isolating barrier of 280 Ω and use 1500 m of 0.75 mm² cable at about 24.5 Ω per km. Cable resistance becomes 2 × 1.5 × 24.5 = 73.5 Ω and the total becomes 603.5 Ω.
At 20 mA the drop is 12.07 V, leaving 11.93 V, only 1.43 V above a 10.5 V transmitter. At the 22 mA upscale failure level of NAMUR NE43 the transmitter would get just 10.72 V, so this loop diagram should use a larger cable or a lower resistance isolator.
Using the Loop Diagram During Loop Checking
During commissioning, each loop diagram becomes the test sheet for that loop. The field method is explained in instrument loop checking procedure, and the two stages of testing are compared in cold loop and hot loop testing.
- Tag numbers match the drawing, field label and DCS database.
- Continuity and insulation checked on every core before power up.
- Polarity confirmed at transmitter, junction box and marshalling.
- Screen earthed at one end only, as marked on the sheet.
- Signal injected at 0, 50 and 100 percent and seen on the HMI.
- Alarm and trip set points match the drawing and cause and effect.
- Valve stroke and fail position confirmed against the sheet.
- Red line mark ups returned to document control.
Any wiring difference found in the field is marked in red on the loop sheet and signed. Those red lines later become the as built revision, which is the version maintenance will depend on for years.
- Shows the full signal path on one sheet.
- Speeds up loop checks and commissioning.
- Reduces fault finding time for maintenance.
- Supports safe isolation and modifications.
- Large projects need thousands of sheets.
- Quickly becomes wrong without change control.
- Manual drafting is slow and error prone.
- Depends on accurate I/O and cable data.
How a Loop Diagram Is Prepared
Preparation begins after the instrument index, I/O list and cable schedule are stable. Most EPC contractors in India generate loop sheets from a database tool, where each tag, cable and terminal is entered once and reused on every drawing.
The system integrator then supplies the final rack, slot and channel assignments, often after the factory acceptance test. Only then can the loop diagram be issued for construction with complete terminal data.
Abbreviations on the sheet, such as JB, MC, SC and TB, follow the project legend and the terms in instrumentation and automation abbreviations. Keep the legend on the first sheet of every loop diagram set.
ISA 5.4 Standard Preview for Instrument Loop Sheets
Instrument Loop Drawing Video Lesson
Loop Diagram FAQ
A loop diagram is a drawing of one instrument loop showing every device, cable, terminal, junction box and control system channel. It adds the wiring and tubing detail that the P&ID deliberately leaves out.
Technicians use it to build, test and repair the loop in the field. It is the most detailed drawing of a single control loop on any project.
ISA 5.4, the ISA standard for instrument loop drawings, gives guidelines for preparing and using these drawings. It lists the minimum required information and the optional information for each sheet.
Tag letters and numbers on the sheet follow the ISA 5.1 identification rules. Many owners add their own template, legend and title block on top of both standards.
The drawing needs loop and device identification, a function description and links to related loops. It must show every point to point connection with cable, core and terminal numbers.
It should also show device locations, energy sources and enough of the process to give context. The action of each device and the valve fail positions complete the minimum set.
A P&ID shows process lines, equipment and the control philosophy for a whole process unit. It does not show any wiring, terminal, junction box or I/O channel detail.
The loop diagram takes one tagged loop from that sheet and shows its complete electrical and pneumatic path. It is therefore the drawing used for loop checks and daily maintenance.
ISA style drawings place the field on the left and the control room on the right as a simple convention. Reading from left to right then follows the signal naturally from the process.
This fixed layout makes every loop diagram in a large set look alike. Technicians find terminals faster because they always know where to look first.
The instrument design team of the EPC contractor normally prepares them from a database tool such as SmartPlant Instrumentation. The system integrator later supplies the final rack, slot and channel data.
Commissioning engineers then red line any field changes found during loop checks. Document control finally issues the as built revision for long term maintenance use.
Each sheet becomes the test record for its loop during commissioning. Technicians confirm tags, continuity, polarity and earthing against it before any power is applied.
They then inject 0, 50 and 100 percent signals and verify each reading on the operator screen. Results and any red line changes are signed on the same sheet by the witnesses.
Related Articles
- Instrument Loop Checking Procedure
- Marshalling Cabinet DCS Wiring
- Piping and Instrumentation Diagram
- Cold Loop and Hot Loop Testing
- PLC Wiring From Field Instrument to System Cabinet
External References
- ISA 5.4 1991 Instrument Loop Diagrams, ISA
- Lessons in Industrial Instrumentation, Instrumentation Documents, control.com
- Piping and Instrumentation Diagram, Wikipedia
What We Learn Today
- A loop diagram shows the complete path of one instrument loop, including devices, cables, cores, terminals, junction boxes, marshalling and I/O channels.
- ISA 5.4 sets minimum content such as identification, connections, locations, energy sources, process context and device actions or fail positions.
- Loop sheets are used as test records during loop checks, and every field change must be red lined so the as built drawing stays accurate.