
A process gas chromatograph doesn't just measure a gas. It separates a mixture into its individual parts first, then measures each one on its own.
That single idea explains almost everything about how these analyzers work.
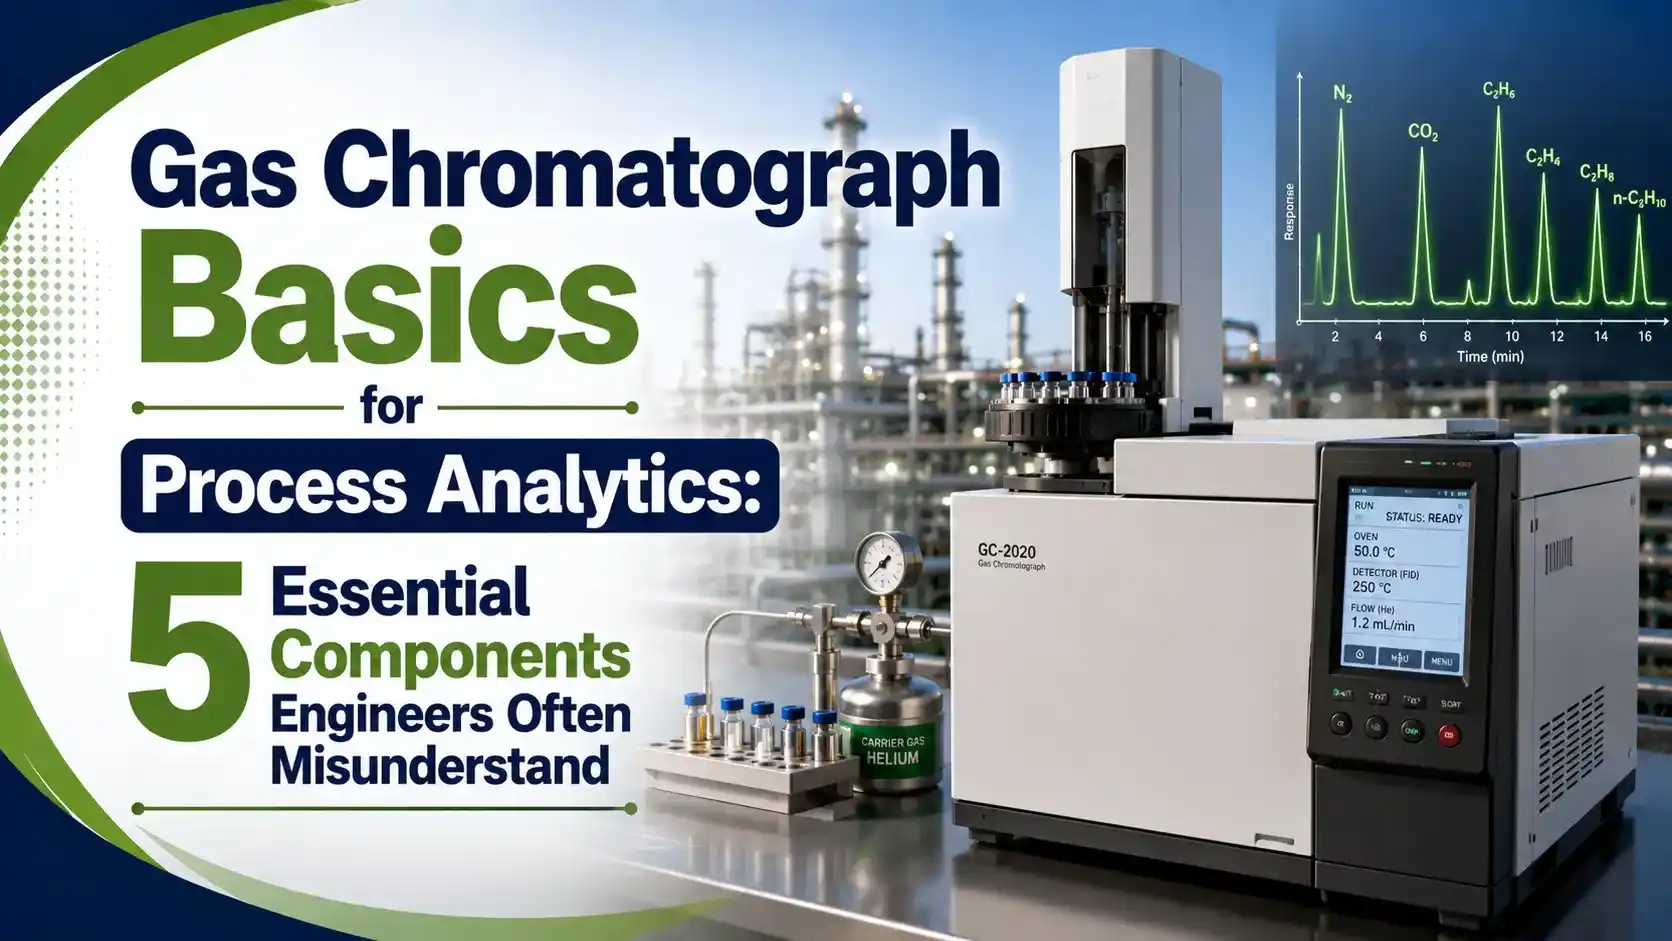
Gas chromatograph basics for process analytics start with one simple job: separate a gas mixture into individual components, then measure each one as it exits the column.
A process gas chromatograph, or GC, sits online at the plant. It pulls a small sample directly from the process line every few minutes.
That sample gets separated and measured automatically, with no lab technician involved. The result feeds straight back into the control room or DCS.
This is very different from a lab GC. A lab instrument runs one sample at a time, by hand, whenever someone submits it for testing.
A process GC runs the same analysis cycle continuously, day and night. It's built for repeatability, not flexibility.
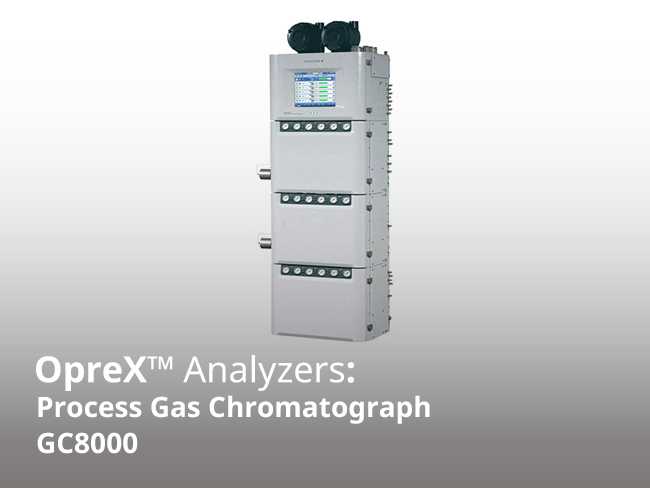
The 5 Essential Components of a Process Gas Chromatograph
Every process GC, no matter the brand, is built from the same five building blocks.
Sample Handling System
Filters, dries, and regulates the process sample down to a clean, steady pressure before it ever reaches the analyzer.
Carrier Gas and Injection Valve
An inert gas, usually helium, nitrogen, or hydrogen, pushes a precisely timed slug of sample into the column.
Column Inside a Temperature Controlled Oven
A long, narrow tube that separates the sample by how strongly each component clings to the material packed inside.
Detector (TCD or FID)
Senses each component as it exits the column and turns that presence into an electrical signal.
Controller Electronics
Times the whole cycle, reads the detector signal, builds the chromatogram, and reports results to the DCS.
TCD vs FID: The Two Main Gas Chromatograph Detectors
Most process GCs use one of two detector types, and the right choice depends entirely on what's being measured.
Thermal Conductivity Detector (TCD)
A universal detector. It compares the thermal conductivity of the sample gas to the carrier gas and needs no ionization at all.
Flame Ionization Detector (FID)
Burns the sample in a hydrogen flame and measures the resulting ion current. It's far more sensitive to hydrocarbons.
How Retention Time Separates a Gas Mixture
Every component in the sample takes a slightly different amount of time to travel through the column. That travel time is called retention time.
Lighter, less reactive molecules move fast. Heavier or more strongly attracted molecules lag behind.
Retention time is fixed for a given column and set of conditions. That's exactly what lets an analyzer identify a peak automatically, every single cycle, without a person looking at it.
Reading a Gas Chromatograph Chromatogram
The final output is a chromatogram: a plot of detector signal against time. Each peak represents one component.
Peak height or area tells the software how much of that component is present.
BTU Calculation from Gas Chromatograph Component Data
For natural gas, the GC's real job is often to calculate heating value, not just composition. Each component has a known heating value in BTU per standard cubic foot.
Multiply each component's mole fraction by its heating value, then add them up.
| Component | Gross Heating Value (BTU/scf) |
|---|---|
| Methane (C1) | 1010.0 |
| Ethane (C2) | 1769.6 |
| Propane (C3) | 2516.1 |
| n-Butane (C4) | 3262.3 |
| Nitrogen, CO2 (inerts) | 0.0 |
This exact weighted average method is what GPA 2172 and ISO 6976 describe for custody transfer gas quality reporting.
Live Natural Gas Heating Value Calculator
Enter the mole percent of each component from a GC analysis to estimate the gas mixture's gross heating value.
Where Process Gas Chromatographs Are Used
Natural Gas Pipelines
BTU value and composition for custody transfer billing.
Refineries
Distillation point, PIONA, and FCC unit monitoring.
Petrochemical Plants
Ethylene, propylene, and butadiene purity tracking.
Fine Chemicals
PPM level analysis for high value specialty products.
Environmental Monitoring
VOC analysis in flue gas, wastewater, and air quality.
Gas Processing Plants
Composition control for dew point and NGL recovery.
Why Sample Handling Matters So Much
Most process GC problems don't start at the detector. They start upstream, in the sample handling system.
A dirty, wet, or poorly regulated sample throws off every result downstream. That's why sample conditioning gets so much engineering attention.
✓ Good Sample Conditioning
- Filters remove particulates before the sample reaches the valve
- Pressure regulators hold a steady, low inlet pressure
- Heated lines prevent condensation on heavier components
- Sample line length is kept short to reduce lag time
✗ Common Sample Handling Mistakes
- Long, unheated sample lines that let heavy ends condense out
- Worn filters that let particulates reach the injection valve
- Pressure swings that distort peak areas cycle to cycle
- Ignoring the Joule Thomson cooling effect during pressure letdown
Routine Maintenance Checks for Process Gas Chromatographs
A process GC needs regular attention to keep its chromatogram basics accurate. These checks catch most problems early.
Verify Retention Times
Compare current peak times against the calibrated baseline for each component.
Check Carrier Gas Purity and Pressure
Low purity or unstable pressure both show up as baseline noise or peak drift.
Run a Calibration Gas Cycle
A known standard confirms response factors are still valid for every component.
Inspect the Sample Filter
A clogged or bypassed filter is one of the most common causes of slow drift.
Column Types Used in Process Gas Chromatography
Not every column separates the same way. Understanding gas chromatograph basics for process analytics means knowing which column fits which job.
Packed Columns
Filled with solid or liquid coated packing material. Rugged and simple, common for permanent gas analysis.
Capillary Columns
A thin coated bore gives sharper peak separation. Better resolution for complex hydrocarbon mixtures.
Column choice directly affects how well two close peaks separate. Poor separation means overlapping peaks and unreliable results.
Why Process Analytics Depends on Consistent Cycle Timing
A process gas chromatograph repeats the exact same timed sequence every cycle. Injection, separation, and detection all happen on a fixed schedule.
That consistency is what makes automated peak identification possible. Any drift in timing risks confusing one peak for another.
Advantages and Limitations of Process Gas Chromatographs
✓ Advantages
- Measures ppm to 100 percent in a single analysis cycle
- Fully automated, continuous operation with no manual sampling
- Directly identifies individual components, not just a bulk property
- Well established calibration standards through GPA and ISO methods
✗ Limitations
- Analysis cycle takes minutes, not instantaneous like some analyzers
- Column and detector need periodic maintenance and recalibration
- Carrier gas supply and sample conditioning add ongoing cost
- Retention time drift can misidentify peaks if not monitored
Reference Materials on Process Gas Chromatography
FAQs on Gas Chromatograph Basics for Process Analytics
External References
- Working Principle of Gas Chromatograph, Inst Tools
- Gas Chromatograph Calibration, GPA 2261 and ISO 6974
- Process Gas Chromatographs, Yokogawa
- Process Gas Chromatograph GC8000 Brochure, Yokogawa
- Heating Value Measurement of Natural Gas, AMETEK Process Instruments
What we learn today
- These gas chromatograph basics for process analytics cover the same five components inside every process GC, regardless of manufacturer.
- A process gas chromatograph separates a mixture, then measures each component individually as it exits the column.
- Every GC shares five basic parts: sample handling, injection valve, column and oven, detector, and controller electronics.
- TCD suits inert gases, while FID is far more sensitive for hydrocarbon trace analysis.
- Retention time identifies each peak, and calibration standards keep that identification accurate cycle after cycle.
- For natural gas, GC data feeds directly into a weighted BTU calculation used for custody transfer billing.