
Table of Contents
TogglePiping and Instrumentation Diagram (P&ID)
If you have ever opened a Piping and Instrumentation Diagram (P&ID) for the first time, it can look confusing and overwhelming. Lines, symbols, tags, numbers, and small notes are spread across the drawing & without proper understanding, it is easy to miss important details.
Once you know how to read a Piping and Instrumentation Diagram, it becomes one of the most powerful documents in any process plant.
A Piping and Instrumentation Diagram shows how equipment, piping, valves, and instruments are connected and how a process is controlled and monitored. It acts as a common language between design engineers, instrumentation engineers, operators, maintenance teams, and commissioning staff.
From plant design and construction to day-to-day operation and troubleshooting, almost every technical decision relies on information available in the P&ID.
In this article, we will learn how to read a Piping and Instrumentation Diagram step by step. Instead of memorizing symbols, the focus will be on understanding the logic behind the drawing, how fluids flow, how measurements are taken, how control loops are formed, and how safety is ensured.
P&ID Symbols and Codes
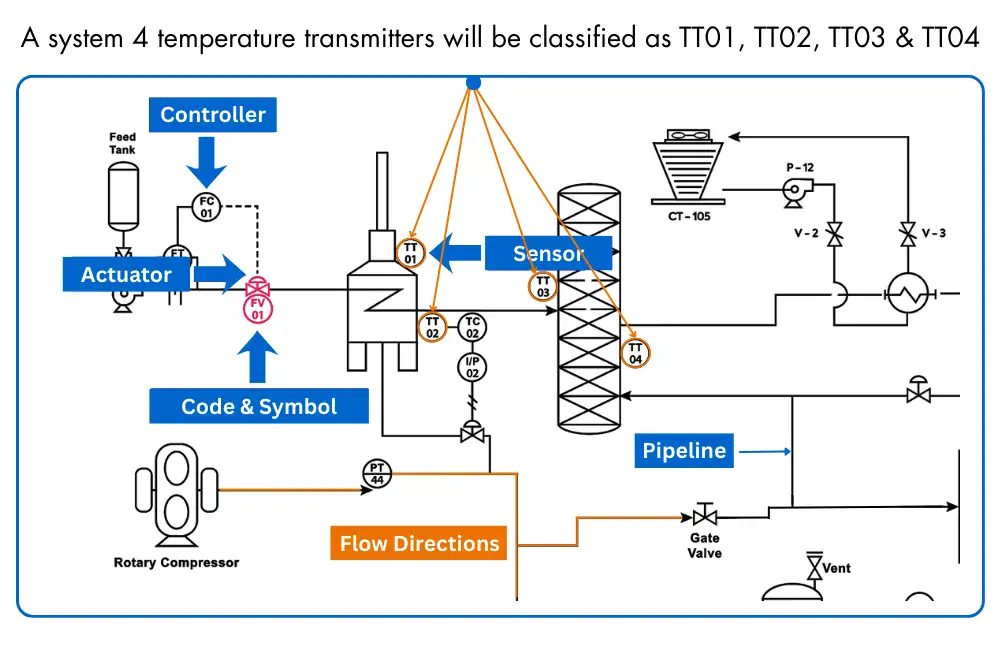
In a Piping and Instrumentation Diagram, symbols are used to represent actual plant equipment in a simplified way. Instead of drawing real devices, standard symbols show
1. sensors that measure pressure, temperature, flow, and level,
2. actuators that move valves, and
3. controllers that handle control actions.
This makes the diagram easy to read and consistent for everyone.
Process equipment in a Piping and Instrumentation Diagram is identified using clear symbols and tag codes. These normally include
1. valves and control valves,
2. instruments, and
3. pipelines, allowing engineers and technicians to understand the process layout without confusion.
Apart from main equipment, a Piping and Instrumentation Diagram also shows important supporting details. You will often see
1. vents,
2. drains, and
3. sampling lines, along with flow direction arrows and control signal lines. Interconnection references indicate how one diagram connects to another, helping users read the entire plant step by step.

P&ID Code Format
Instrumentation codes used in Piping and Instrumentation Diagrams follow a standard and logical format. With regular exposure to P&IDs, these codes become familiar and easy to recognize.
Until then, standard reference tables are widely available and are commonly used during design, commissioning, and maintenance work.
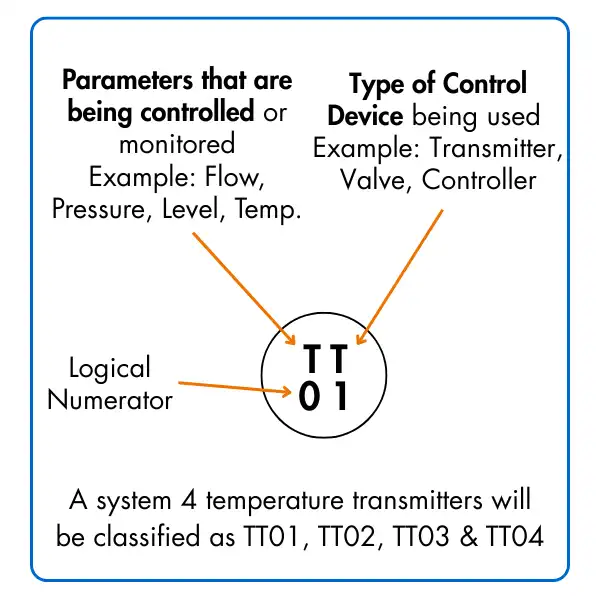
Each instrumentation tag in a P&ID carries specific meaning.
1. The first letter identifies the measured or controlled parameter, such as Flow, Temperature, Level, or Pressure.
2. The next letter indicates the type of device, for example a Transmitter, Controller, or Valve.
3. The number represents the unique identification of the instrument within that loop, allowing it to be traced and referenced across drawings and documents.
This tagging system ensures that every instrument in the plant is clearly identified, avoids duplication, and allows engineers, operators, and maintenance teams to communicate using a common and consistent language.
P&ID Instruments Location
Now we know that a device such as TT-01 is represented by a circular symbol, the next step is to understand where that instrument is physically located.
A P&ID communicates this information directly through the way the circle is drawn.
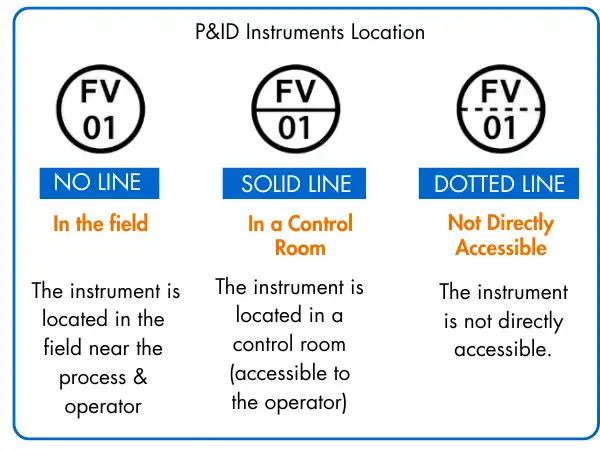
The presence or absence of a horizontal line inside the circle indicates the instrument location. These representations are standardized and commonly used across industries.
1. No line inside the circle
This indicates that the instrument is installed in the field, close to the process equipment and accessible to plant operators or maintenance personnel.
2. Solid line inside the circle
This shows that the instrument is located in a control room or panel and is directly accessible to the operator for monitoring or control.
3. Dotted line inside the circle
This means the instrument is not normally accessible, such as devices installed inside panels, cabinets, or hazardous or restricted areas.
Understanding these simple visual cues helps you quickly identify not just what the instrument does, but also where it is installed in the plant.
P&ID Piping and Connections
The connection lines shown on a Piping and Instrumentation Diagram also provide important information about the instrument and how it is connected. The line style is used to indicate the type of connection between devices.
A solid line represents a physical process connection, meaning the interconnection is made through pipework carrying the process fluid.
A dotted line, on the other hand, represents an electrical connection, such as signal wiring between instruments, transmitters, controllers, and control systems.
By reading these line types correctly, you can quickly understand whether an instrument is connected mechanically through the process or electrically through control and signal wiring.

Watch this video to get more insights
Frequently Asked Questions (FAQs)
1. What is a Piping and Instrumentation Diagram?
A Piping and Instrumentation Diagram is a detailed drawing that shows how process equipment, piping, valves, and instruments are connected and how a process is measured and controlled.
2. What is the main purpose of a P&ID?
The main purpose of a P&ID is to provide a clear and standardized reference for design, installation, operation, maintenance, and troubleshooting of a process plant.
3. How is a P&ID different from a PFD?
A Process Flow Diagram (PFD) shows only the major equipment and overall process flow, while a Piping and Instrumentation Diagram includes detailed piping, instruments, control loops, and signal connections.
4. What information can be understood from instrument tags on a P&ID?
Instrument tags indicate
1. the measured parameter,
2. the type of device, and
3. the unique identification number, helping users understand the function, location, and role of each instrument.
5. How do P&IDs show instrument location?
Instrument location is shown using the symbol style. The presence or absence of a line inside the instrument circle indicates whether the device is installed in the field, control room, or an inaccessible location.
6. How are process connections and signal connections identified in a P&ID?
Solid lines represent process or piping connections, while dotted or dashed lines indicate electrical or signal connections between instruments and control systems.
7. Who uses Piping and Instrumentation Diagrams?
P&IDs are used by design engineers, instrumentation engineers, operators, maintenance teams, and commissioning personnel throughout the entire lifecycle of a plant.
What we learn today?
In this article, we learn the basic interpretation of a P&ID (Piping and Instrumentation Diagram) and how it is used to understand a process system. We learned that every instrument involved in the process is shown on the P&ID using standard symbols and identification codes.
By reading these symbols and codes, it becomes possible to understand
1. what type of device it is,
2. where it is physically located
3. how it is connected to the rest of the process.
We also saw how line styles and symbol details provide additional information about piping, signal types, and accessibility.
To read a Piping and Instrumentation Diagram effectively, familiarity with standard instrument symbols and identification letter codes is essential. With regular practice, P&IDs become easier to read and serve as a reliable reference throughout the plant lifecycle from design and installation to operation and maintenance.
We hope this article helped you build confidence in reading P&IDs. If you have suggestions for related instrumentation topics you would like us to cover next, feel free to share them.


I hope you like above blog. There is no cost associated in sharing the article in your social media. Thanks for Reading !! Happy Learning
2 Comments